
Bitcoin is pushing back toward $86K after buyers defended the $80K short-term demand zone once again, with BTC trading close to $85K. The rebound comes as markets price in roughly a 25% chance of another Fed hike at the late October meeting, following September’s quarter-point increase. Meanwhile, the NVM Ratio has climbed to its highest level since early 2026, indicating that BTC might be overvalued in terms of network activity.
Bitcoin Price Analysis: The Daily Chart
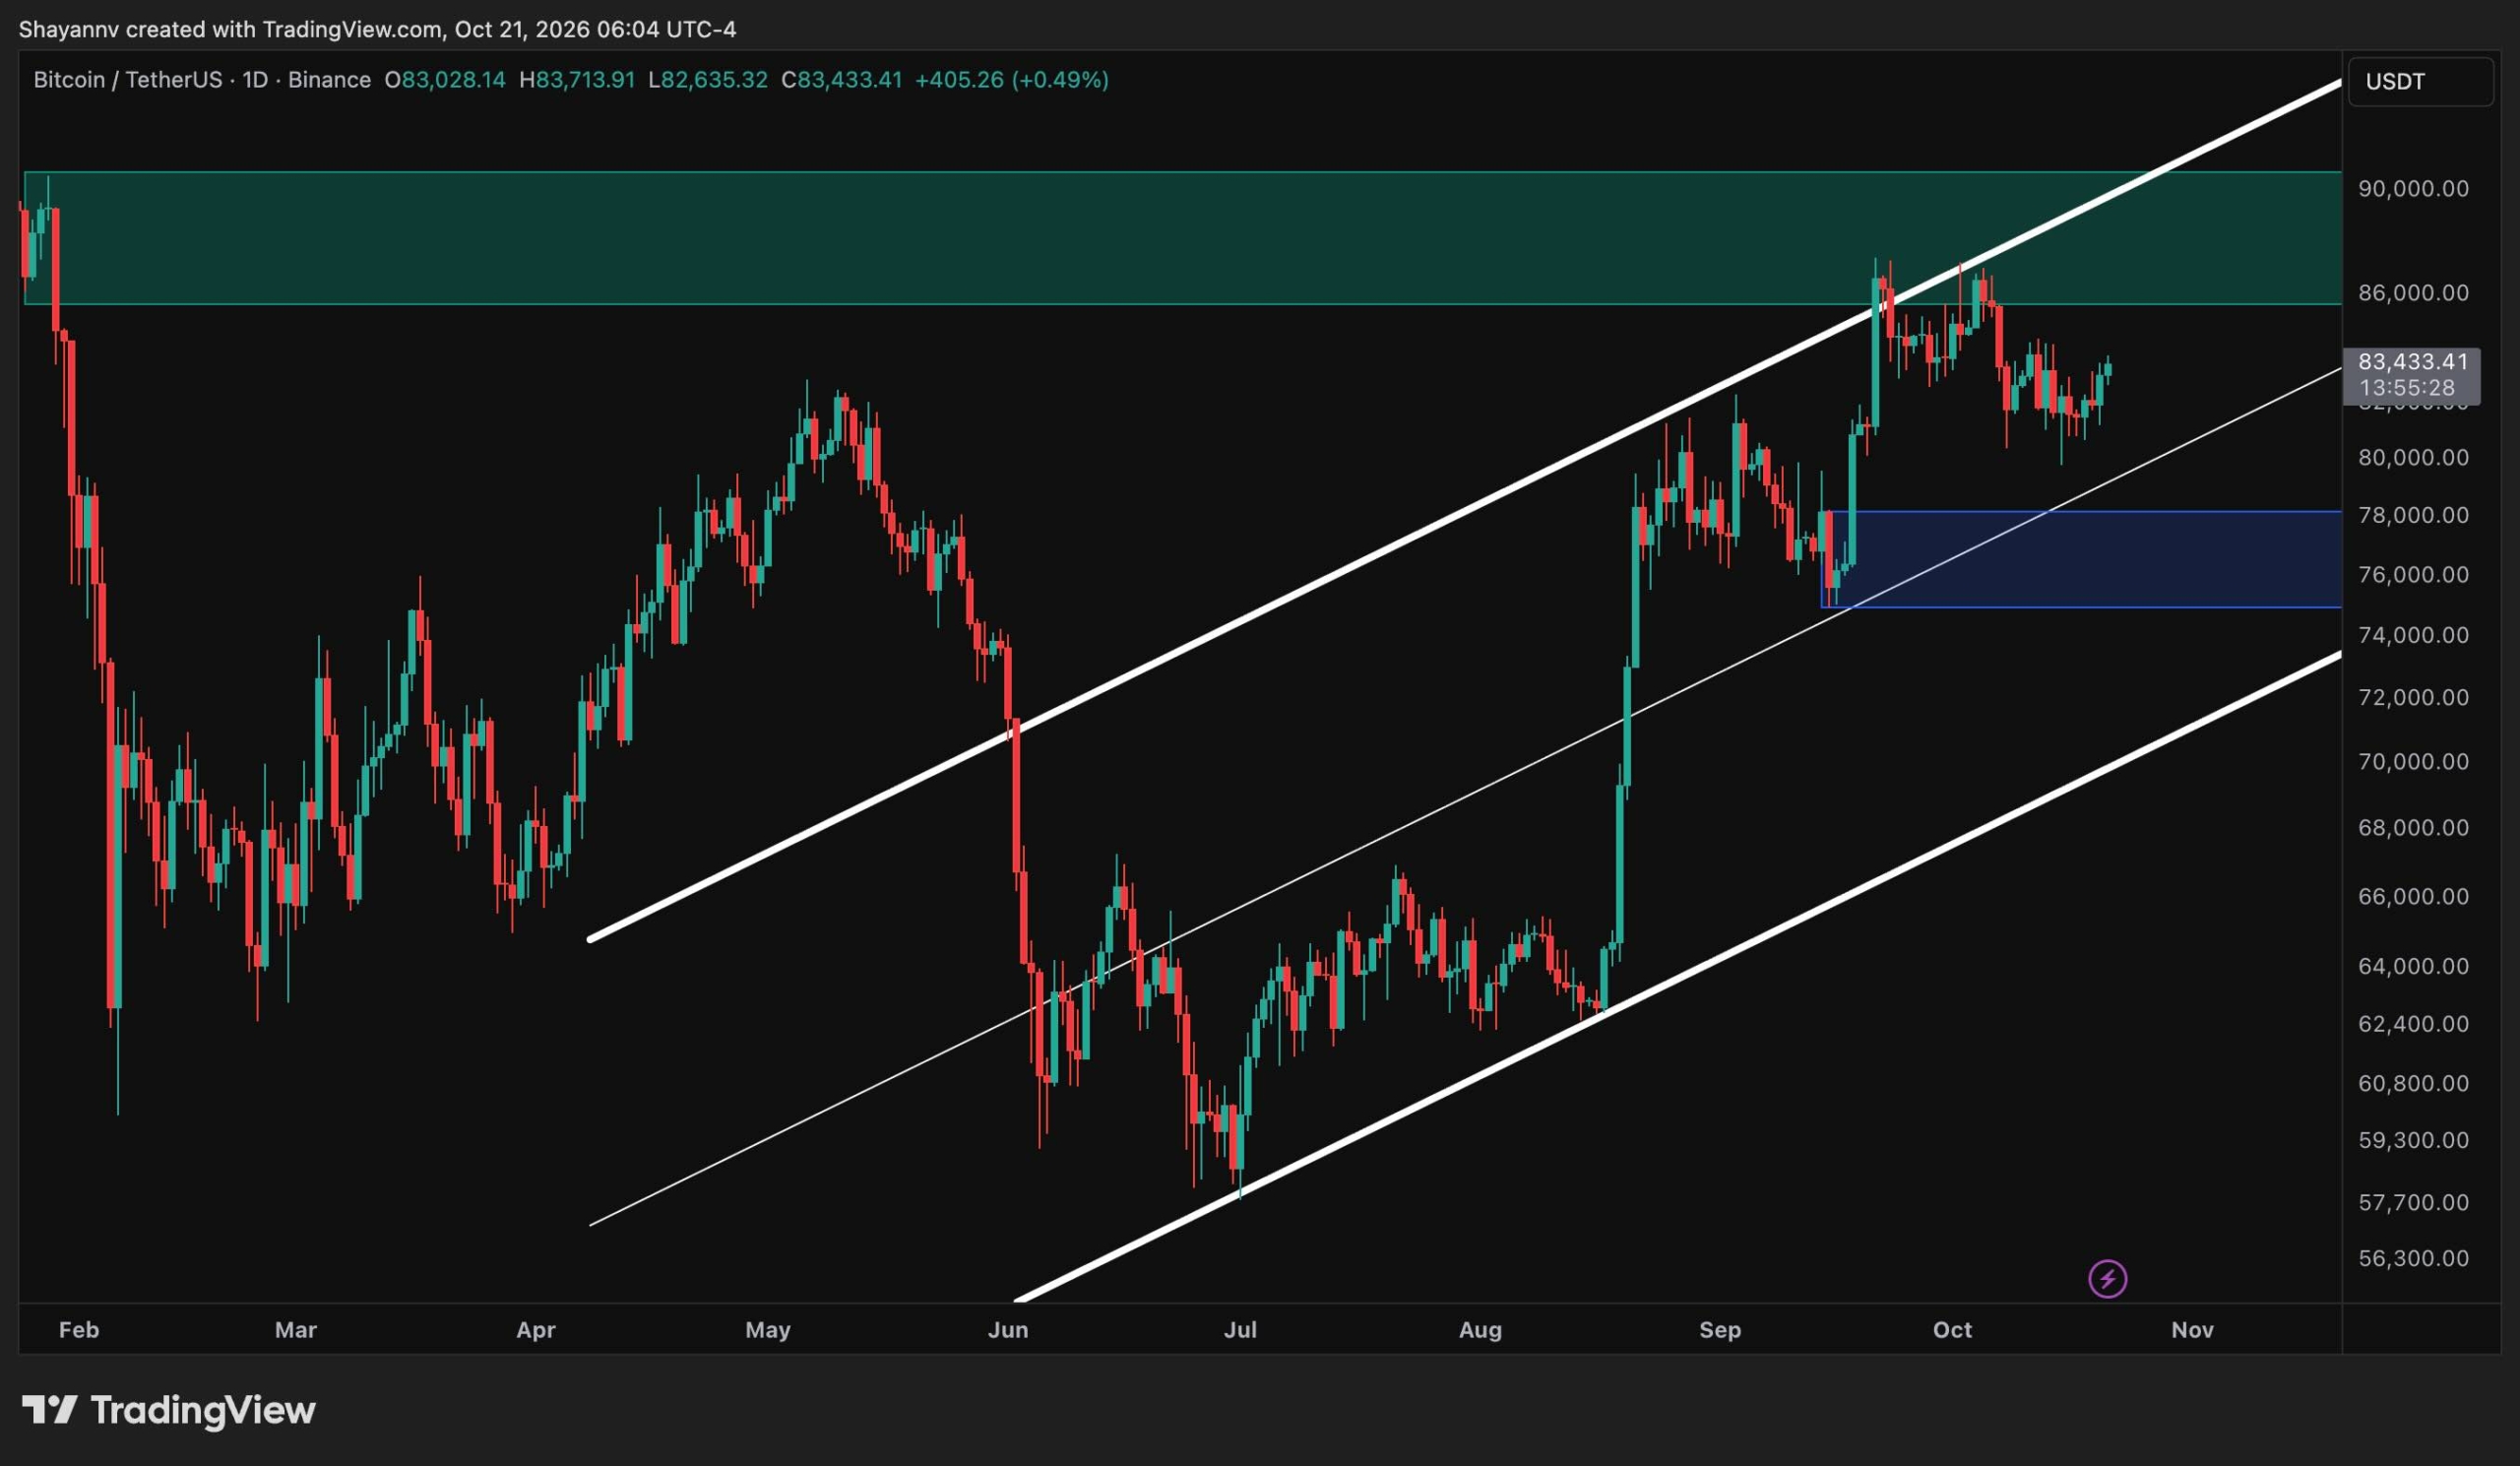
BTC continues to trade within the ascending channel that has defined the recovery from the late-June lows near $58K. The rally carried price into the $86K-$90K supply zone, where the February sell-off began. Two attempts to break through this area produced only wicks toward $87K, as the market was rejected to the downside.
The structure remains constructive as long as Bitcoin holds above the channel’s midpoint, currently near $80K. A decisive daily close above $86K would be needed to break into the supply zone and open the way toward $90K.
Losing the channel midline, however, would shift the focus to the $75K-$78K weekly order block, which was the base of the September rally. Below that, the lower channel boundary near $72K is the final structural support before the recovery channel would be invalidated.
BTC/USDT 4-Hour Chart
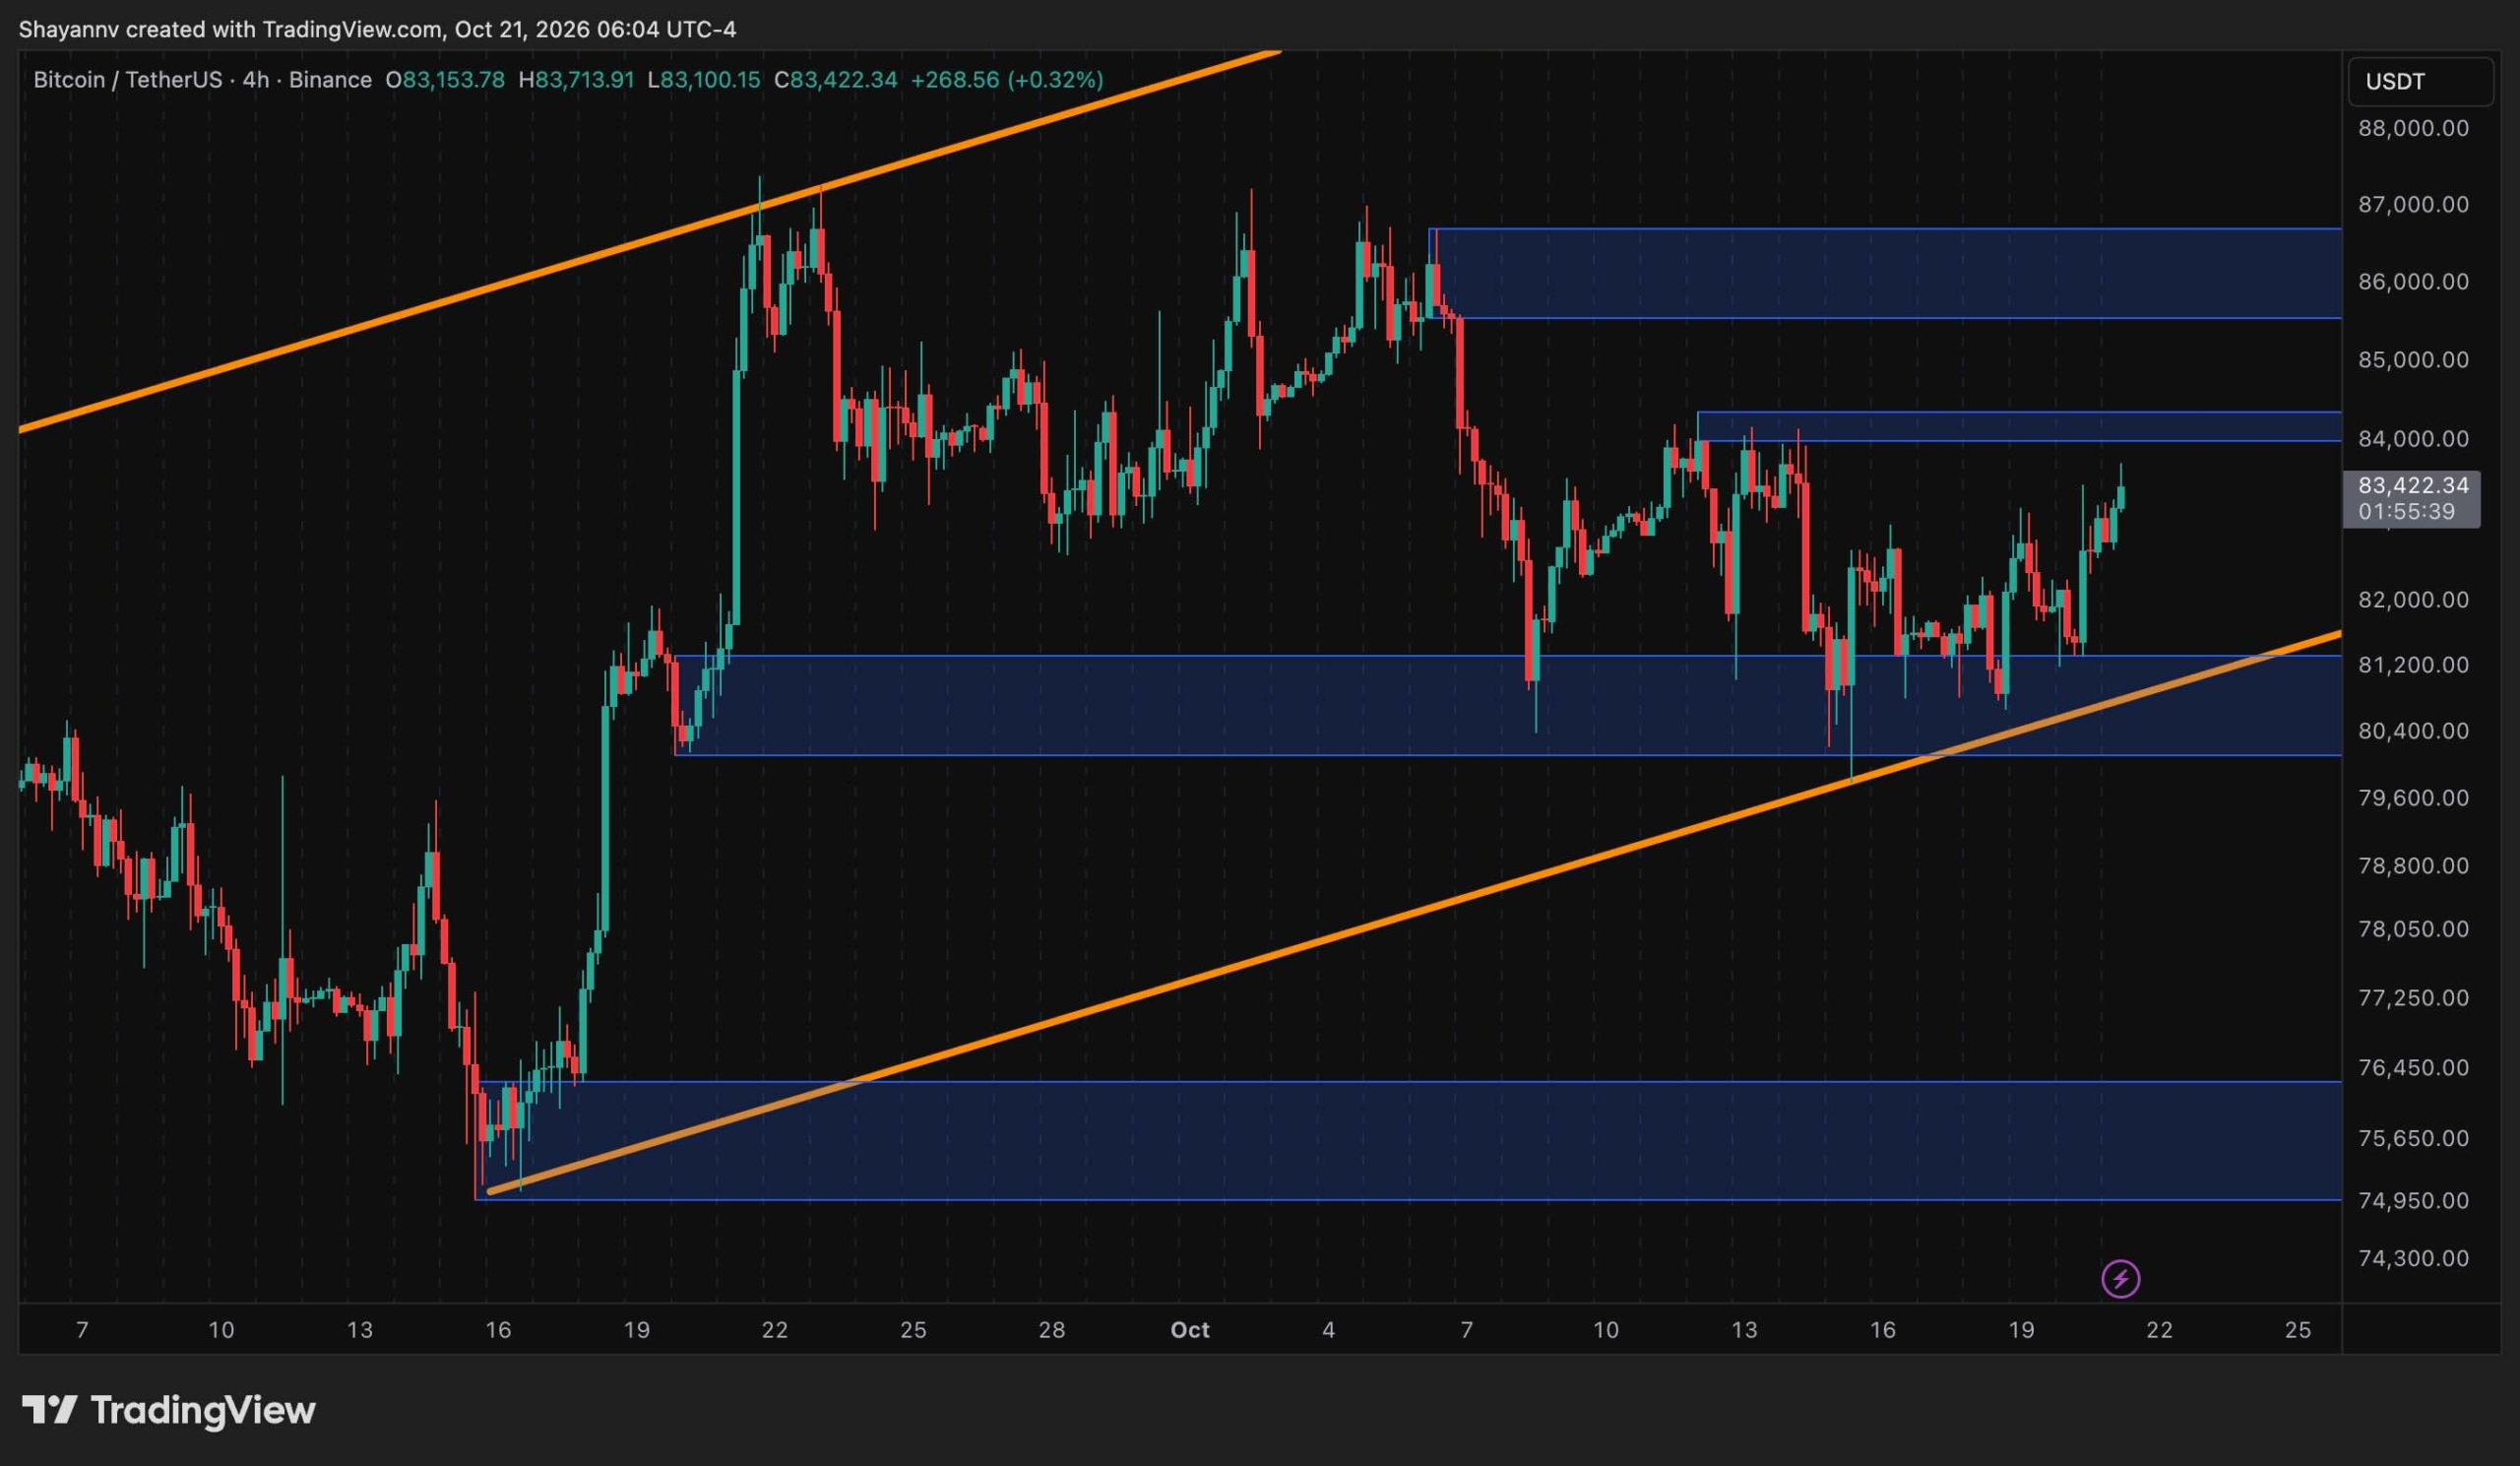
The 4-hour chart shows Bitcoin inside a rising short-term channel since the mid-September low near $75K. After the October 6 rejection from $86K, the price began forming lower highs. Each decline, however, has been absorbed by the $80K demand zone, which now converges with the channel’s lower trendline.
BTC is currently pressing against the 84K–84.3K supply zone, created by the October 12 lower high. A clean break above it would end the short-term sequence of lower highs and bring the 85.6K–86.6K zone, where the October 6 sell-off originated, into play.
A rejection from the $84K level would likely send the price back toward the same $80K demand area. Losing both this zone and the lower trendline would expose the $75K region, mentioned in the daily timeframe analysis. Still, with the price creating a higher low on the 4-hour chart, the market seems to have a valid chance to break above $84K.
On-Chain Analysis
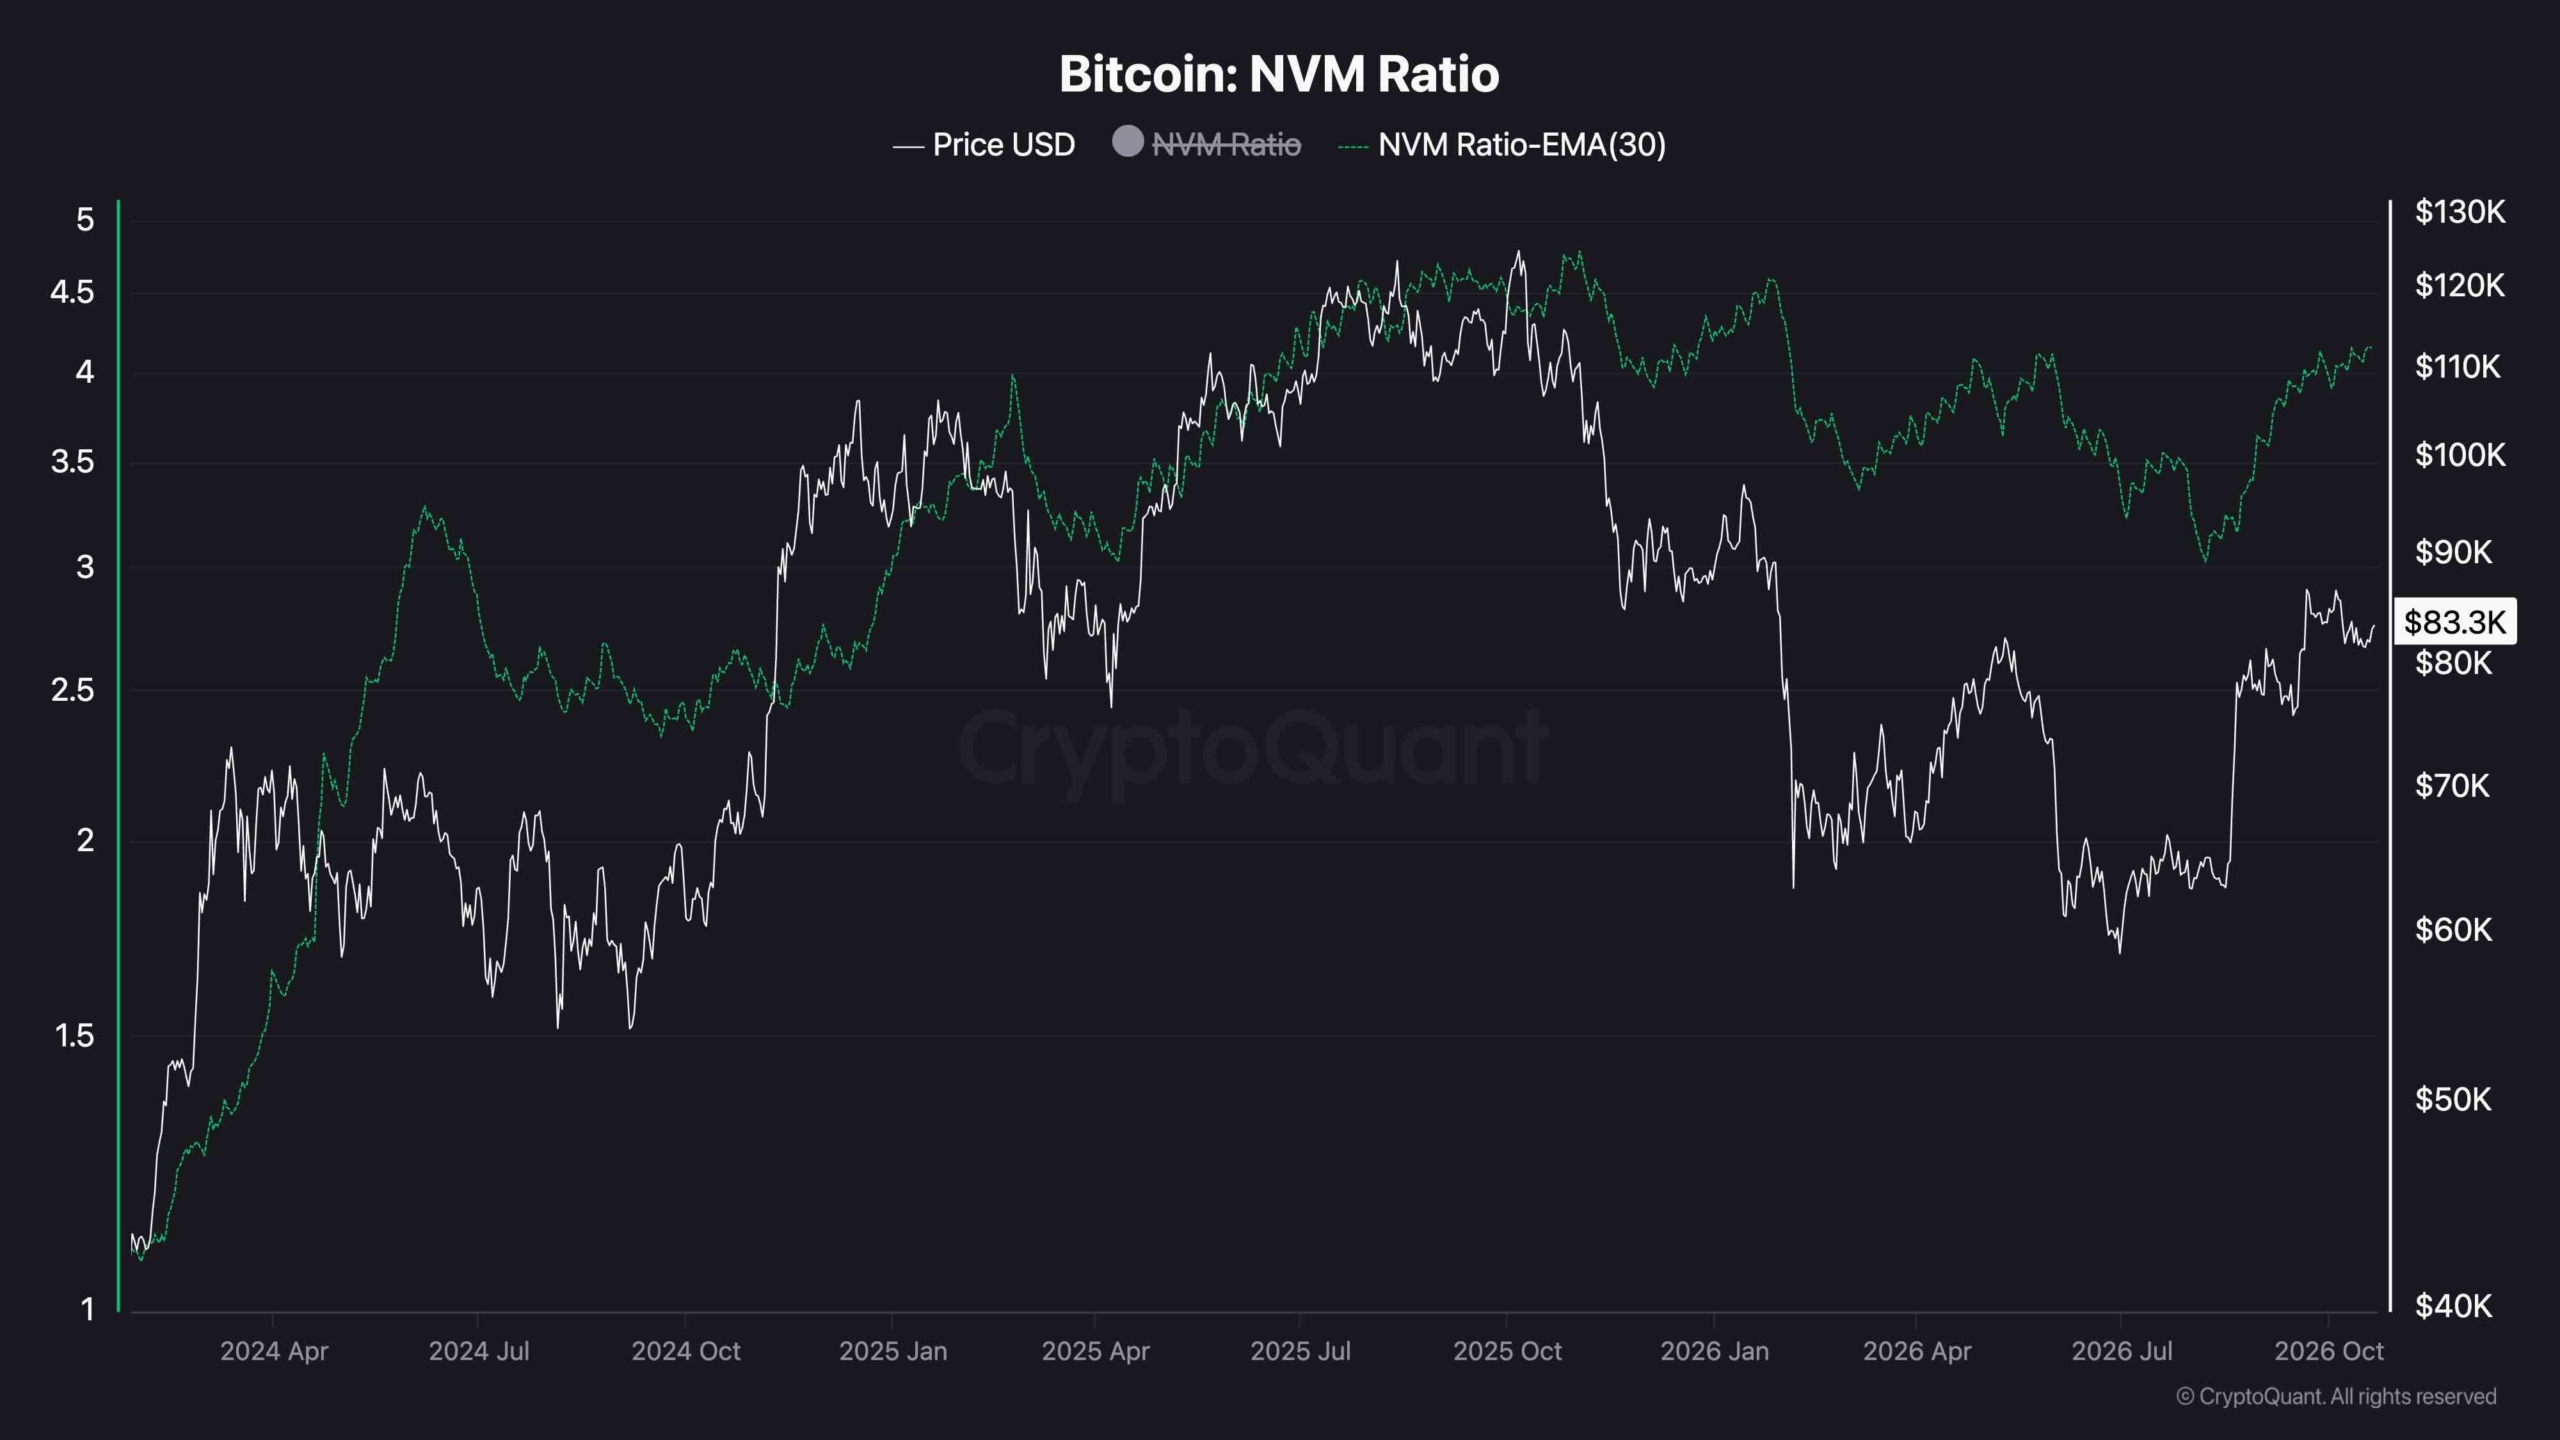
The NVM Ratio on CryptoQuant compares Bitcoin’s market capitalization with the square of its daily active addresses. It is based on Metcalfe’s law, which holds that a network’s value grows with the square of its users. Active addresses act as a proxy for real economic usage, so a rising ratio suggests that valuation is outpacing that activity.
The 30-day EMA of the ratio peaked above 4.5 during Bitcoin’s 2025 run toward its all-time high. It climbed back toward 4.4 in January 2026, shortly before the February sell-off toward $65K. After falling to around 3.0 in August, the metric has rebounded to approximately 4.1, even though BTC still trades roughly a third below its peak.
This does not constitute a sell signal by itself, as ETFs and custodians move much of Bitcoin’s activity off-chain and likely push the ratio higher over time. Still, the elevated reading implies thinner valuation support from network usage, making the $80K demand zone even more important to hold in the short term.
The post Bitcoin Price Analysis: BTC Blasts Past $84K – Is $90K the Next Target? appeared first on CryptoPotato.



Comments (0)
Please sign in to comment.
No comments yet. Be the first to comment.