
S&P 500 Daily Chart Analysis For Week of August 7, 2026
S&P 500 SPCFD:SPX
Technical Analysis and Outlook:
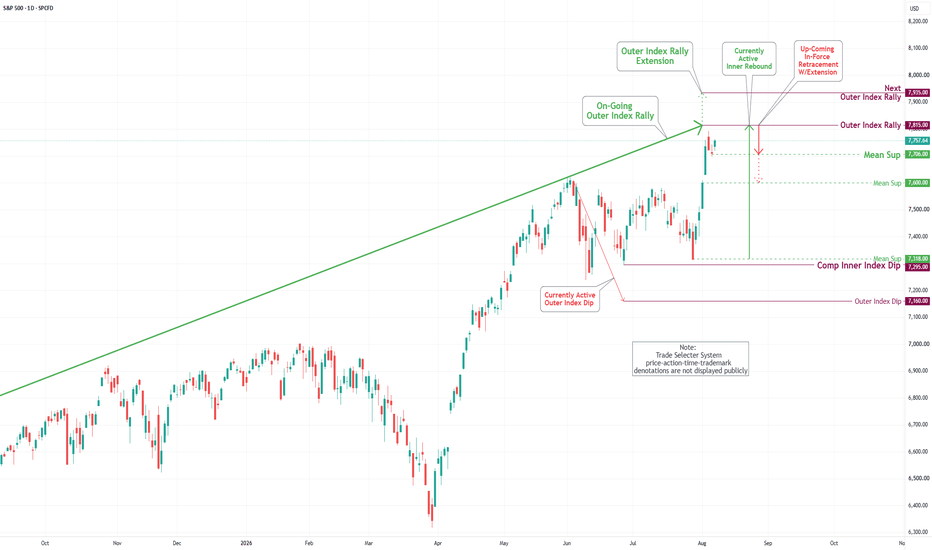
The S&P 500 Index has shown a substantial increase following its retest of the completed Outer Index Rally level at 7,610, successfully reaching the subsequent Outer Index Rally target at 7,707.
This significant upward trend indicates that the ongoing Active Rebound is poised to hit the current open target designated as Outer Index Rally at 7,815, with a further target identified at 7,935 in the near future.
On the flip side, there exists a scenario characterized by an In-Force Retracement, which may lead to a correction to the Mean Support level at 7,706. Should this downward movement persist, the index may also confront the Mean Support level posted at 7,600.

