BTCUSD: Liquidity Above, Structure Below
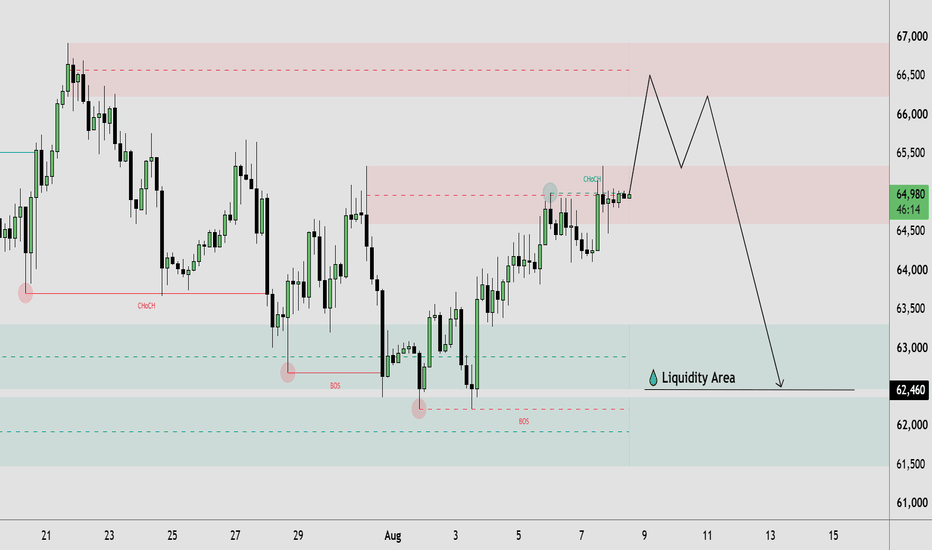
🔹 BTCUSD is showing a developing bullish market structure after a series of higher lows from the 62,000–63,000 area. Price has pushed back above the recent 64,500 region and is currently consolidating inside a highlighted resistance/supply zone near 64,500–65,300. The recent CHoCH suggests a shift in short-term price action, while the nearby resistance remains an important area for confirmation. The chart also highlights liquidity resting below the current structure, making this zone relevant for both breakout and rejection scenarios.
🔸 If BTCUSD gains acceptance above the highlighted resistance area, price could continue toward the upper liquidity zone around 66,200–66,600. However, rejection from resistance could lead to a retracement toward the 63,000–62,500 support and liquidity area. Traders may wait for clear price confirmation before considering any trade, especially around the marked resistance and support zones. A sustained break below the lower structure could weaken the current bullish market structure.
This analysis is for educational purposes only and does not constitute financial or investment advice. Always conduct your own research before making trading decisions.