XAUUSD: Bullish Wave 5 Targets Higher
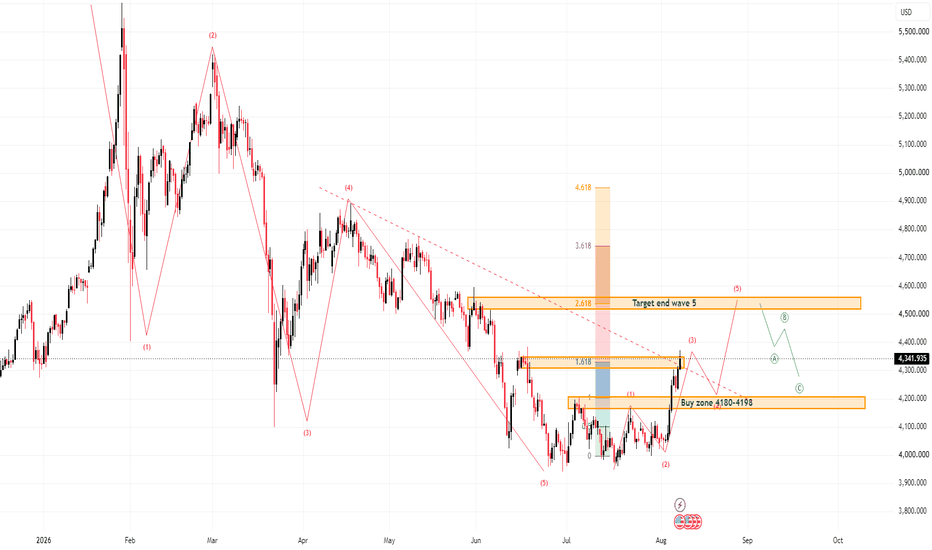
Gold is showing a clear bullish recovery after breaking away from the lower accumulation base. From Kelly’s view, the current structure suggests that XAUUSD is no longer only moving sideways; buyers are trying to build a larger Elliott Wave continuation towards the upper Fibonacci target.
The key idea is simple: gold remains bullish, but after a strong push, the better setup is to wait for a controlled pullback before following the next upside wave.
⟡ Market structure
The chart shows gold previously traded under a strong downtrend structure, but the latest recovery has changed the short-term rhythm. Price has pushed above the lower base and is now reacting around 4,341, close to the first important resistance area.
This area is important because price may pause here after a strong impulse move. A pullback from this zone would not automatically break the bullish view. Instead, it may form wave 4 before the market prepares for another upward move.
The main buy zone to watch is 4,180–4,198. If gold corrects into this area and buyers defend it, the next bullish leg may continue towards the higher Fibonacci target zone around 4,520–4,560, where the chart marks the possible end of wave 5.
➤ Key levels
◌ 4,180–4,198: main buy zone and possible wave 4 support
◌ 4,341: current price reaction area
◌ 4,380–4,400: near resistance and breakout checkpoint
◌ 4,520–4,560: target end wave 5 / Fibonacci extension zone
◌ Below 4,180: area where the bullish setup starts to weaken
◌ Below 4,100: deeper invalidation area for the current wave count
⌁ Elliott Wave view
From an Elliott Wave perspective, gold appears to be forming a bullish 5-wave structure after the previous bearish cycle slowed down near the lower base.
Wave 1 created the first strong recovery move.
Wave 2 corrected but held above the structure base.
Wave 3 is now pushing price into the 4,340 resistance region.
Wave 4 may form as a healthy correction back into 4,180–4,198.
If this buy zone holds, wave 5 may continue towards the 4,520–4,560 Fibonacci target area.
This is why Kelly would not chase gold directly after the strong rise. The structure is bullish, but the cleaner entry usually comes after the market retests support and confirms buyers are still active.
▸ Trading scenario
Preferred scenario: wait for gold to correct into the buy zone and show bullish confirmation.
Entry zone: 4,180–4,198 if bullish confirmation appears
Stop loss: below the confirmed wave 4 low or below 4,150
Take profit 1: 4,341–4,380
Take profit 2: 4,400
Take profit 3: 4,520–4,560
Alternative scenario: if gold breaks below 4,180 with strong bearish pressure, the bullish wave 5 setup becomes weaker. In that case, price may need to rebuild a deeper support base before the next bullish continuation becomes reliable.
⌁ Kelly’s view
For Kelly, the main structure is still bullish. Gold has already shown strong buying pressure, and the current move looks like part of a larger Elliott Wave recovery.
The cleanest plan is to wait for the pullback. If 4,180–4,198 holds, gold may continue the next bullish wave towards the upper Fibonacci target.
Gold is in a bullish continuation phase.
If the buy zone holds, wave 5 may extend higher.
Share your view below.