Bitcoin is testing a critical support area after failing to break above the descending resistance structure that has capped the price for months. With BTC trading around $62.7K, the market is approaching a key decision point, while the elevated Exchange Whale Ratio adds a potentially bearish on-chain signal to the technical picture.
Bitcoin Price Analysis: The Daily Chart
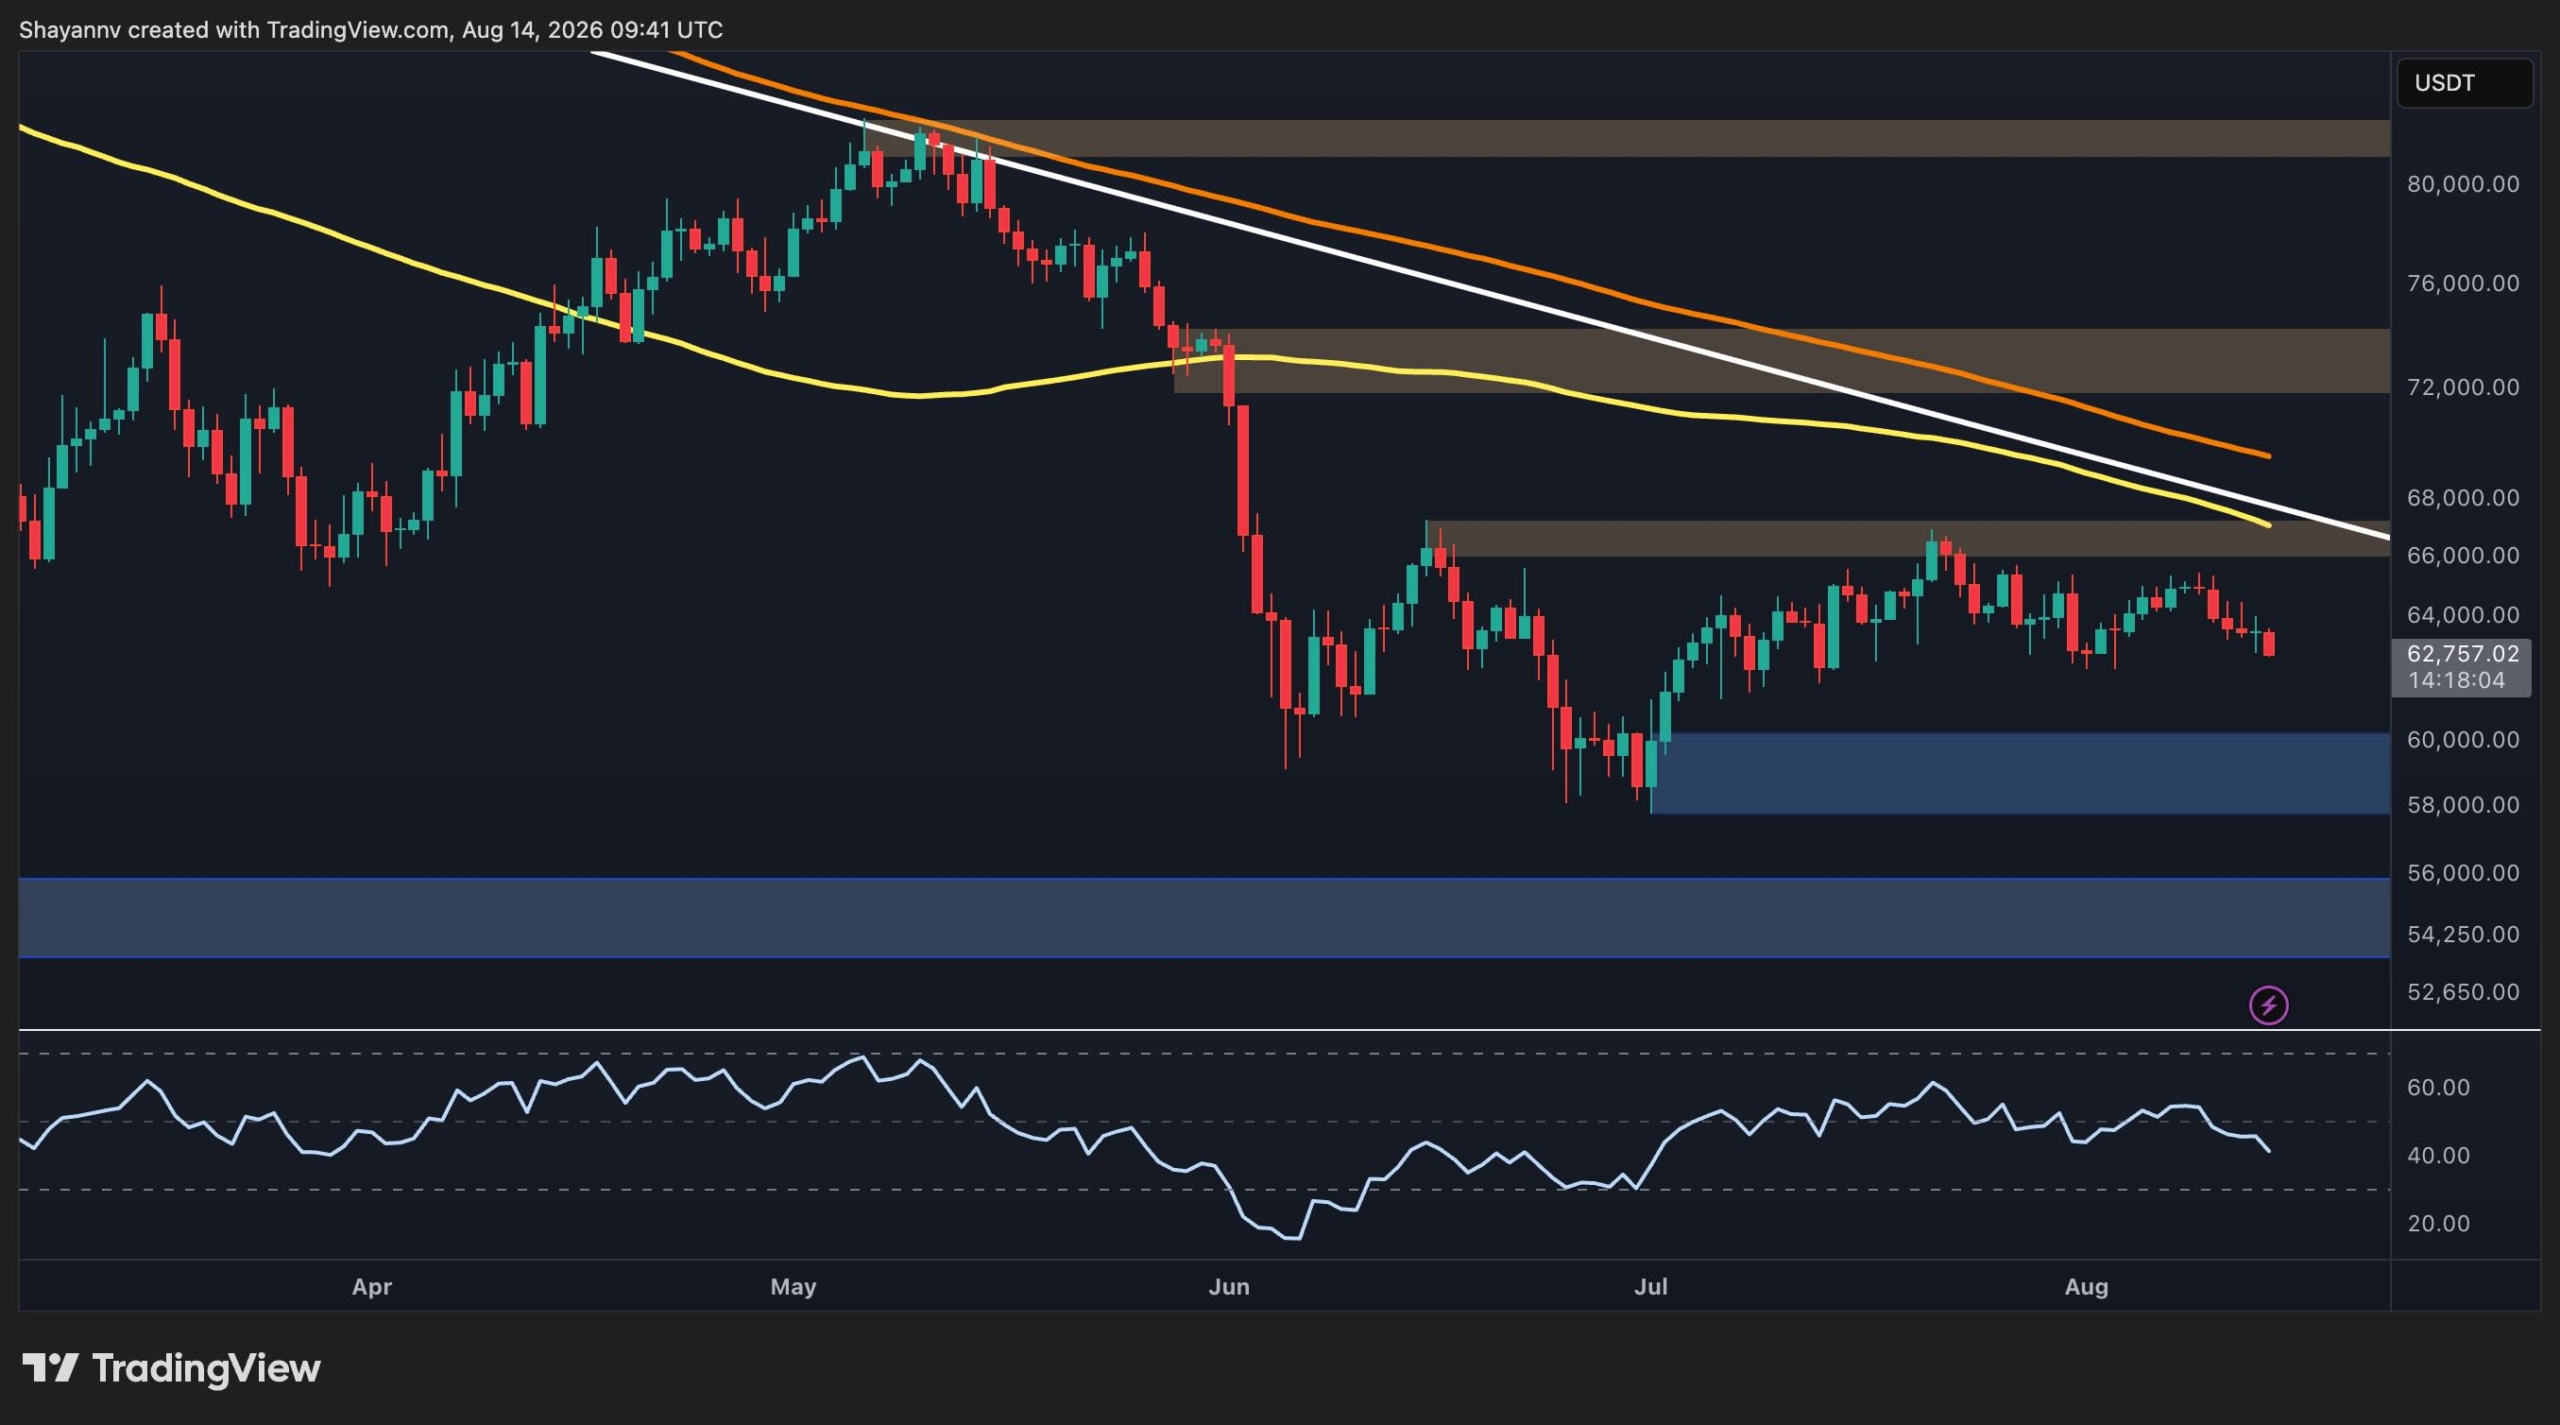
The daily chart shows that Bitcoin remains within a broader corrective structure. After recovering from the June low near $58K, BTC established a series of higher lows and climbed toward the $66K resistance zone. However, the recovery has so far failed to produce a decisive breakout, and price has recently turned lower.
The most important resistance is currently around $66K-$67K, where the descending trendline, the horizontal supply zone, and the broader moving-average structure converge. A daily close above this area would represent a meaningful improvement in market structure and could open the way toward the $72K-$74K zone. Beyond that, the $80K-$82K region remains a major higher-timeframe resistance area.
On the downside, BTC is approaching the $60K support zone once again. This area will most likely attract buyers and is therefore important for maintaining the recent recovery structure. A decisive daily breakdown of this zone would increase the probability of a move below the $58K low and toward the next major support visible on the chart around $55K.
Momentum is also not particularly encouraging at the moment. The daily RSI is around the mid-40s and has turned lower, indicating that bullish momentum has weakened without yet reaching deeply oversold conditions. Meanwhile, BTC remains below the major moving averages, which continue to slope downward. As a result, the broader daily structure remains cautious to bearish until the $66K-$67K area is reclaimed.
BTC/USDT 4-Hour Chart
The 4-hour chart provides a more immediate picture of the current setup. BTC has been trading inside a contracting structure, with a descending upper trendline and a gradually rising lower boundary. The price is now pressing toward the lower end of this formation near $62K.
The immediate support zone is around $61.5K-$62K. The price is aggressively moving toward this area today, while the 4-hour RSI has also fallen to the low 30s, showing that short-term momentum has become weak and is approaching oversold territory. This leaves room for a relief bounce if buyers defend the support zone, although the RSI alone is not enough to confirm a reversal.
A rebound from the current area could initially target $65K high ,where the upper boundary of the triangle pattern is also located. This area is followed by the critical $66K-$67K resistance zone. Therefore, the market would first need to break the pattern to the upside before any short-term rally could materialize.
Conversely, a clean 4-hour breakdown below $61.5K-$62K area would invalidate the immediate bullish structure and likely expose the $58K-$60K demand zone. Therefore, the current region is particularly important, as a successful defense could preserve the consolidation or even lead to a rally, while a breakdown would signal another leg lower, which could be disastrous for Bitcoin holders and the crypto market as a whole.

On-Chain Analysis
The Exchange Whale Ratio measures the share of exchange inflows represented by the largest whale transactions. In the chart, the 30-day moving average of this metric has climbed sharply and is currently just below 0.32, close to the highest levels visible over the displayed period.
The elevated reading is notable because it comes while Bitcoin is trading near $62K and struggling to regain its major technical resistance levels. A high whale ratio means that whales account for a relatively large portion of coins entering exchanges, which can indicate increased potential selling pressure if those coins are subsequently sold.
The divergence between the elevated whale activity and weak BTC price action therefore represents a cautionary signal. It does not guarantee an immediate sell-off, but it suggests that the current support test should be treated carefully. If the Exchange Whale Ratio remains elevated while BTC loses the $62K zone, the on-chain and technical signals would increasingly point toward further downside, as it would indicate that the decline is driven by whale supply.

The post Bitcoin Price Analysis: Is $60K Back in Play After BTC’s Latest Rejection? appeared first on CryptoPotato.