
Why your higher-timeframe indicator looks perfect on history
If an indicator pulls a higher timeframe down onto your chart, two settings have to agree with each other. When they do not, the usual result is a script that looks flawless on every historical bar and cannot reproduce it live.
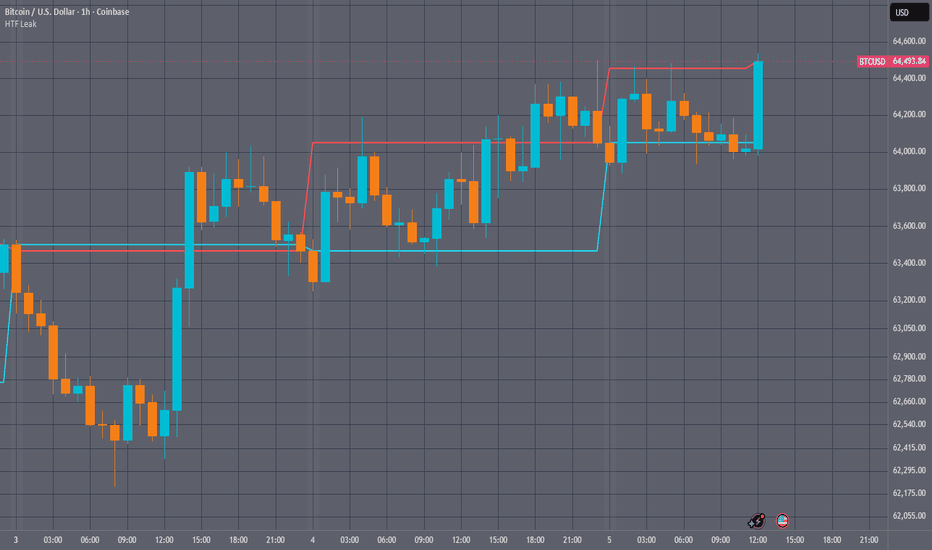
The two lines here are the same call. Same symbol, same daily timeframe, same lookahead_on. The only difference is a one-bar offset on the expression.
Red asks for the daily close with no offset. Look at where it sits during the early hours of each day: it is already at that day's closing price. At 01:00 that number does not exist yet. Every historical bar of the red line was drawn knowing how the day would end.
Cyan asks for the previous day's close instead. That is a number that was knowable at the time, so the line is honest. It is also duller, which is rather the point.
A strategy built on the red line backtests beautifully. It has been reading tomorrow's newspaper. Live, there is no newspaper.
The fix is not simply "turn lookahead off". The offset and the lookahead setting are interdependent, and TradingView's docs say neither can be removed without compromising the result. Drop the offset and you leak the future. Turn lookahead off while keeping the offset and it is worse than it looks: the higher-timeframe bar only arrives once it has closed, so history picks up a full timeframe of lag that the live bar never has. History and live then disagree, which is exactly what you were trying to avoid.
The correct form is both together: expr with lookahead_on. Any offset of one bar or more works, and is larger and strictly safer.
If you run indicators you did not write, this is worth checking before you trust a backtest. The script drawing these two lines is published open source as HTF Lookahead Demo, so you can read exactly what it does.
