Silver (SI1!) | Elliott Wave Structure and the Paths Ahead
Silver (SI1!) | Elliott Wave Structure and the Paths Ahead
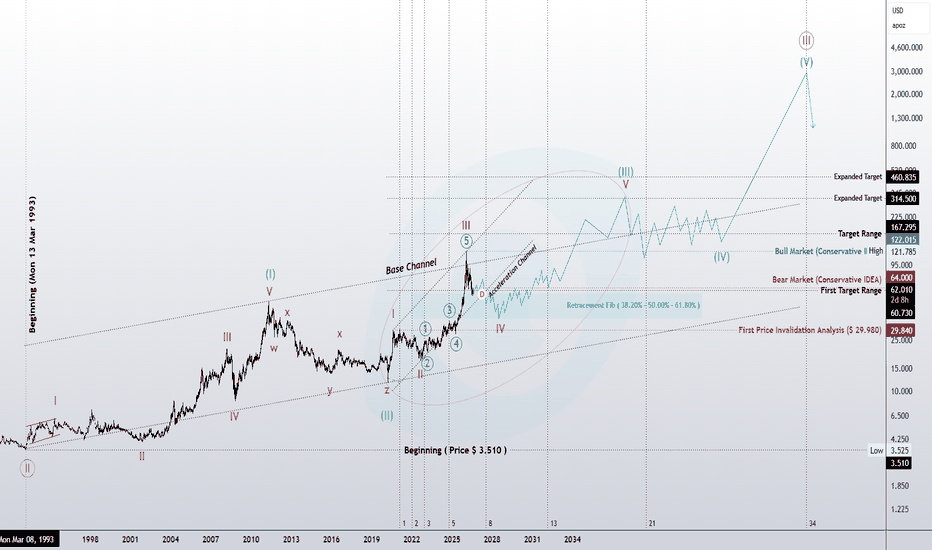
Silver’s long-term structure remains focused on the aggressive Elliott Wave scenario, shown by the blue path.
Under this count, Silver may have completed a major Wave 1 at the 2011 peak, followed by a deep and complex Wave 2 correction. The current advance may now be the early stage of a larger Wave 3.
However, a bullish structure does not mean price must move higher without corrections. From here, Silver may form a small short-term correction or develop a larger and more complex corrective pattern. The structure, depth, and relationship of that correction to the previous impulsive advance will help determine the more probable path.
Gold and the U.S. Dollar Index (DXY) may provide additional context. Silver often moves positively with Gold and inversely with DXY, but Silver’s own price structure remains the primary basis for this analysis.
Previous Weekly Analysis — Published May 17 | TradingView Editor’s Pick

This previous analysis is not included as proof of a guaranteed forecast. It shows how Elliott Wave rules and guidelines can help organize market structure, define probable paths, and follow price as new information develops.
A break above Silver’s historical peak may provide important confirmation of the bullish market structure. Until then, the wave count will continue to be evaluated through price behavior, wave relationships, Fibonacci levels, channels, and clearly defined validation or invalidation points.
The blue path remains the aggressive scenario under consideration. The black path represents the more conservative alternative, allowing for a broader corrective development before the next major advance.
Elliott Wave does not predict the future with certainty. It provides a structured framework for identifying probable paths and adapting to the market as new price information appears.
Price is the result; structure reveals the probable paths.
— Mr. Nobody | Elliott Wave Principle