

NFLX Hourly: Probability and Tradability Are Not the Same Thing
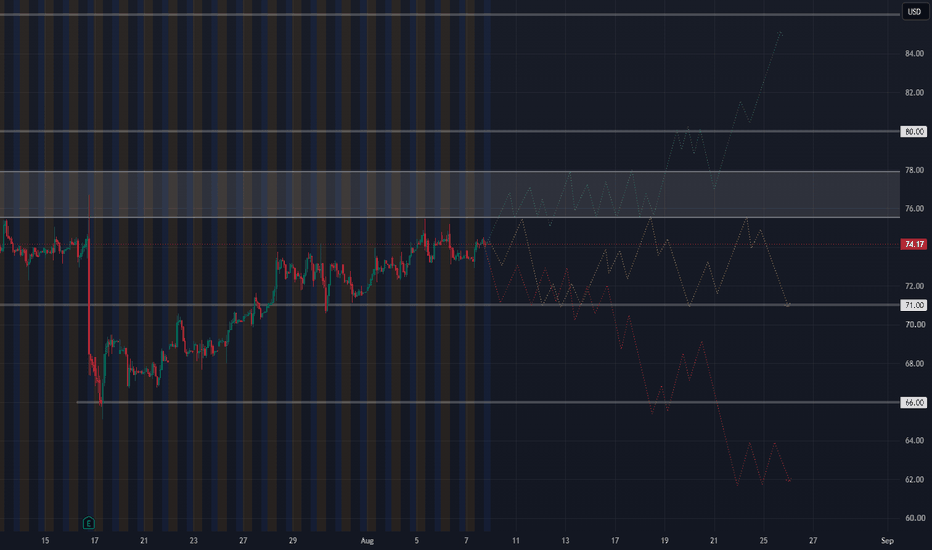
The daily chart gave me the larger roadmap.
The hourly is where the trading question starts getting more useful.
Right now, I see three reasonable scenarios:
Yellow — consolidation
This is probably the most likely scenario from the hourly chart as it sits now. Price is already behaving that way: rotating between nearby support and overhead structure without enough evidence yet for a larger directional move.
But here’s the catch:
Most probable does not mean most tradable.
A choppy range can produce plenty of movement while still giving poor entries, false breaks, weak follow-through and messy invalidation.
So even though consolidation may be the scenario I expect most, it is also the one I like least from a trading standpoint.
Bearish scenario
The red path is different.
If NFLX loses $71 and cannot reclaim it, the trade becomes much cleaner structurally.
Now I have:
a defined breakdown level,
a clear place where the bearish thesis would be wrong,
and $66 as the next major downside reference.
That makes the bearish scenario, in my opinion, the most tradable of the three if it actually develops.
Not because I think it is the most likely.
Because it gives me the cleanest evidence-based decision.
Bullish scenario
The green path is also tradable, but it needs more confirmation first.
Price still has to work through the overhead structure around roughly $75.5–$78, followed by $80.
If NFLX begins reclaiming and holding those areas, the bullish case gets much cleaner. Above $80, I would start looking back toward the larger daily levels at $86 and $92.
So for me, the bullish path ranks between the other two:
More tradable than chop.
Less immediately clean than a confirmed break below $71.
My current ranking
Most probable:
Yellow / consolidation
Green / bullish
Red / bearish
Most tradable if triggered:
Red / bearish
Green / bullish
Yellow / consolidation
That distinction is the whole point of this hourly chart.
I do not need the market to choose the scenario I think is most likely.
I need to recognize when one scenario begins producing cleaner evidence than the others.
The daily chart gives me the structure.
The hourly starts telling me which parts of that structure may actually become tradable.

