Bitcoin Weekly Death Cross: Time to Panic? - August 2026
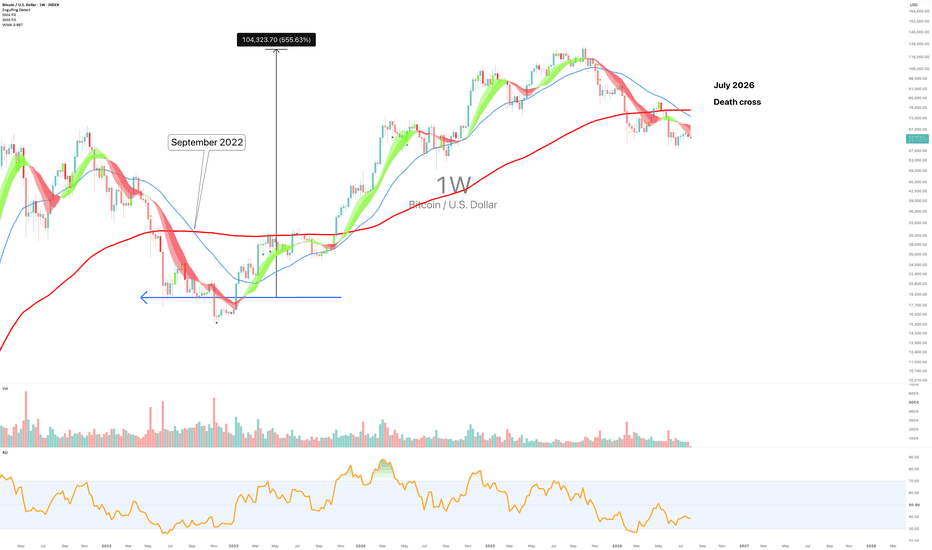
SYMBOL: INDEX:BTCUSD | DIRECTION: LONG | TIMEFRAME: 1-Week
Published: August 2026
Did you know that approximately 80% of discretionary chartists utilise simple moving averages?
A popular signal amongst such traders is the concept of a Golden Cross and a Death Cross. The short-term moving average (typically the 50-period SMA, EMA, or WMA) crosses below the long-term moving average (typically the 200). Price action is also below the long-term moving average at the time of the Death Cross. The same is true in reverse for a Golden Cross.
Price action has printed a Death Cross on the above weekly chart.
Does that mean sell?
Let’s look left, shall we? I know. Boring. What can history possibly tell us?
On the above weekly chart Bitcoin has printed a Death Cross, with the short-term moving average crossing below the long-term moving average and price trading below both. This signal has appeared three times previously on this timeframe. Three occurrences. Three outcomes. All of them the same.
They include:
1) September 2022 Death Cross: +555% gain. The most recent weekly Death Cross printed in September 2022. Bitcoin was trading near $16,000. What followed was the most significant rally in Bitcoin’s recent history, taking price to approximately $126,000 at the cycle peak. A measured gain of 555.63% from the Death Cross date. The signal said danger. The chart went up. Those who sold the Death Cross in 2022 sold the bottom. Just like Micheal Saylor.

2) March 2019 Death Cross: +1,575% gain. The 2019 weekly Death Cross printed with Bitcoin trading below $4,000. The rally that followed took price to approximately $69,000 at the next cycle peak. A gain of 1,575% from the Death Cross point. The crowd was cautious. Macro headwinds were cited. The signal did not care.
3) May 2015 Death Cross: +8,759% gain. The first significant weekly Death Cross on record for Bitcoin. Price was approximately $225 at the time of the signal. The subsequent cycle peak approached $20,000. A gain of 8,759%. Nobody wanted Bitcoin in May 2015. The Death Cross was the reason. History recorded it rather differently.
Targets
$150-154k, would you like an explanation? Will save that for members.
A weekly close and sustained hold below $57,000 would materially weaken the historical analogy. Below that level the pattern comparison to prior cycles breaks down and the thesis requires reassessment.
The crowd
The crowd sees Death Cross and reaches for the sell button. The signal is taught in week one of technical analysis. Death Cross means danger. Death Cross means down. It looks bearish because it is labelled bearish. It appears after a decline, at a moment of maximum pessimism and it tells traders in plain language that the short-term trend has crossed below the long-term trend. Every instinct says exit.
On Bitcoin’s weekly chart, across three previous occurrences spanning eleven years, the Death Cross generated gains of 555%, 1,575%, and 8,759% from the cross date. Three for three. The crowd sold each one. The chart went up each time.
Historically, a Death Cross on this timeframe has been a bullish signal 100% of the time. Is this time different? It is always possible.
…. you know what’s coming.. is it probable? No.
Statistics are wonderful, emotions are expensive.
Ww
Type: Crypto / contrarian historical signal | Timeframe: 12-36 months
=================================================
Disclaimer: This idea is for fans of educational. What it is not, is financial advice. Past occurrences of a technical signal do not guarantee future results.
Capital loss up to and including 100% is possible. Always do your own research and consult a qualified financial adviser before making any investment decisions. Past performance is not indicative of future results.