VRSK: Quality Is High, Valuation Still Matters
 VRSK
- For a company built around recurring insurance data, analytics and deeply embedded industry workflows, that is a significant reset. The Master Buy Scanner V2 has now moved beyond the initial signal and classifies Verisk as:
VRSK
- For a company built around recurring insurance data, analytics and deeply embedded industry workflows, that is a significant reset. The Master Buy Scanner V2 has now moved beyond the initial signal and classifies Verisk as:
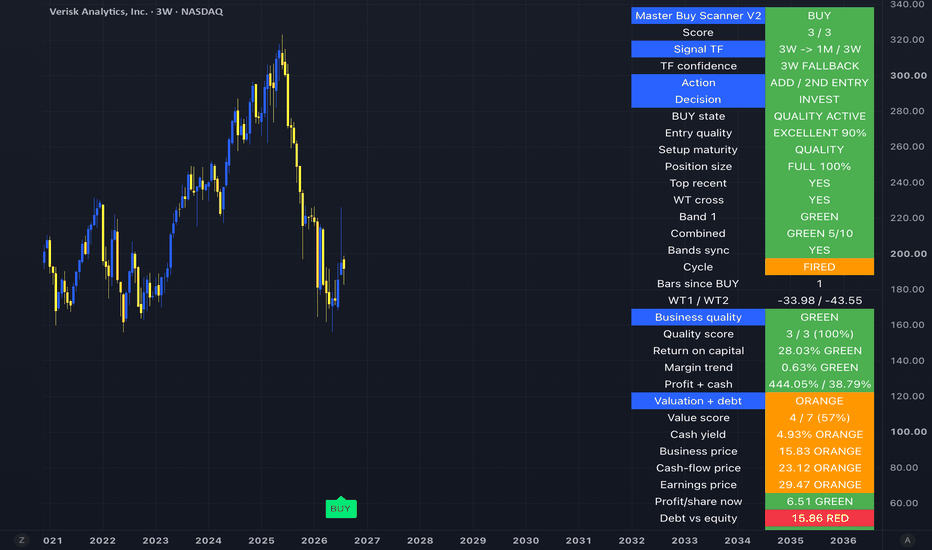
ADD / 2ND ENTRY — QUALITY ACTIVE.
Master Buy Scanner V2 — 3 Week
Score: 3/3
Signal timeframe: 3W → 1M / 3W
Timeframe confidence: 3W FALLBACK
Action: ADD / 2ND ENTRY
Decision: INVEST
BUY state: QUALITY ACTIVE
Entry quality: EXCELLENT — 90%
Setup maturity: QUALITY
Position size: FULL 100%
Top recent: YES
WT cross: YES
Band 1: GREEN
Combined: GREEN 5/10
Bands synchronized: YES
Cycle: FIRED
Bars since BUY: 1
WT1 / WT2: -33.98 / -43.55
This is a strong setup.
The WT cross is confirmed, Band 1 is green, the bands are synchronized and the cycle has fired. Importantly, the BUY signal is only one bar old, while the scanner has already progressed to 2ND ENTRY.
The one limitation is the Combined score at 5/10. Momentum has clearly turned, but this is not yet a maximum-strength recovery.
The business remains extremely high quality
Verisk is deeply embedded in the insurance industry through underwriting data, pricing and loss-cost tools, catastrophe modeling, claims analytics and fraud detection.
Its latest Q2 2026 results remained solid:
Revenue: $806M, +4.3%
Organic constant-currency growth: +5.8%
Underlying subscription growth: +8.0%
Adjusted EBITDA: $464M, +7.4% OCC
Adjusted EPS: $1.98, +5.3%
Free cash flow: $298M, +57.9%
Management also reaffirmed its full-year outlook.
This is therefore not a distressed turnaround. The stock has fallen substantially while the underlying business continues growing.
The moat is particularly attractive
Verisk's value comes from more than selling software.
Its datasets, insurance-industry relationships and integration into underwriting and claims workflows are difficult to reproduce quickly. Insurers use Verisk products to price risks, estimate losses, detect fraud and model catastrophic events.
That creates high switching costs and recurring subscription revenue.
The company is also incorporating generative and agentic AI into these datasets and workflows. Management argues that proprietary insurance data and deep industry integration position Verisk particularly well as AI becomes more important in underwriting and claims.
In this case, AI looks more like a potential productivity and product-enhancement opportunity than an obvious disruption threat.
Scanner business quality: 3/3
The scanner gives Verisk a maximum quality score:
Quality score: 3/3 — 100%
Return on capital: 28.03%
Profitability: exceptionally strong
Cash-generation measure: 38.79%
Adjusted EBITDA margin was already approximately 57.6% in Q2, illustrating just how profitable the underlying model is.
That level of profitability is one reason Verisk has historically commanded a premium valuation.
Valuation is better, but not cheap
This is where the thesis becomes more nuanced.
The scanner gives valuation only 4/7 — 57%:
Cash yield: 4.93% — ORANGE
Business-price multiple: 15.83 — ORANGE
Cash-flow multiple: 23.12 — ORANGE
Earnings multiple: 29.47 — ORANGE
Profit/share: $6.51 — GREEN
So despite the 40% drawdown, Verisk is not deep value.
The market still assigns a premium to the quality and predictability of the business.
The question is whether approximately 23–29x scanner cash flow/earnings measures are reasonable for a company producing mid-single-digit revenue growth, very high margins and strong recurring revenue.
At $300+, that valuation was difficult to defend.
Around $190, it becomes considerably more interesting.
Buybacks strengthen the case
Capital allocation is another important part of the setup.
Verisk launched a $1.5 billion accelerated share repurchase in February 2026, with the initial share delivery calculated at $182.50 per share. It also repurchased another $126 million of shares in the open market during Q1.
In Q2, the company executed another $200 million accelerated repurchase.
That means management is deploying substantial capital into its own stock around broadly similar valuation territory.
If earnings and cash flow continue compounding, retiring shares at depressed prices could materially enhance per-share growth.
Growth is solid rather than spectacular
The scanner gives VRSK 3/4 on growth:
Future profit growth: 7.06% — ORANGE
Estimate trend: neutral
3Y profit growth: 2.61% — ORANGE
3Y sales growth: 7.16% — GREEN
This is the main reason not to treat VRSK like a high-growth technology company.
Verisk's attraction is instead the combination of:
recurring growth + exceptional margins + high returns on capital + strong cash conversion.
For 2026, management continues to guide for:
Revenue: $3.19B–$3.24B
Adjusted EBITDA: $1.79B–$1.83B
Adjusted EBITDA margin: 56.0%–56.5%
Adjusted EPS: $7.45–$7.75
Guidance was reaffirmed after both Q1 and Q2.
Advanced confirmation is strong
The advanced scanner also supports the signal:
Advanced score: 12/14 — 86%
Lifecycle: 2ND ENTRY
Conviction: B+ — 81%
False bottom: OK
Value trap: OK
Data depth: 3/3
Future quality: OK
Relative strength: OK
Failure warning: NO
This is important because the scanner is not simply identifying an oversold condition.
It sees a developing recovery with relatively high confidence.
Key technical levels
Immediate support: $180–$190
Major support: $160–$170
First resistance: $200–$205
Recovery confirmation: $215–$225
Major resistance: $240–$250
Structural recovery zone: $260–$280
Previous high: approximately $320
The rebound from the $160s has already started.
Holding the $180–$190 area would keep the current setup constructive, while a move through $200–$205 would be the first important confirmation.
A recovery above $220 would substantially strengthen the thesis that VRSK has established a durable bottom.
My classification: QUALITY BUY — 2ND ENTRY
VRSK combines:
3/3 scanner score
90% entry quality
Confirmed WT cross
Fired cycle
Synchronized bands
3/3 business-quality score
28% return on capital
Extremely high margins
8% underlying subscription growth
Strong free cash flow
Large ongoing buybacks
Strong 12/14 advanced score
A fresh 2ND ENTRY signal
The main limitations are valuation and moderate growth.
Even after a 40% drawdown, VRSK is not statistically cheap, and the Combined signal remains only 5/10.
But unlike many deeply oversold stocks, Verisk does not need a fundamental turnaround.
It mainly needs its existing business to continue executing.
Current verdict: QUALITY BUY — ADD / 2ND ENTRY.
What would you do?
A) Add around $190
B) Wait for a pullback toward $180
C) Wait for confirmation above $205
Master Buy Scanner V2:

This is not financial advice. Technical signals can fail, and premium-quality businesses can remain under pressure if growth slows or valuation multiples compress further.