XAUUSD Macro Algo Map: High Volatility Equilibrium & Consolidati
💎 XAUUSD Macro Algo Map: High Volatility Equilibrium & Consolidation
📋 Report ID: XAUUSD-WEEKLY-UPDATE-2026-W31
Asset: Gold Spot (XAU/USD)
Timeframe: Weekly (Macro) / Daily (Swing)
📊 Data Anchor: Week of July 27, 2026
🔭 Macro Outlook: Upcoming Week
🔭 Market Context & Price Action
The macro price action printed a high-volatility indecision candle (Doji / Spinning Top), indicating a severe equilibrium and fierce confrontation between buyers and sellers.
After opening at 4090.160, the market initially dropped to sweep buyer liquidity at a physical low of 3996.055. Following this extraction, a sharp rally drove the price up to a high of 4120.495 before structural exhaustion set in, compressing the market to close the week at 4045.165.
🎯 Key Structural Price Zones
The following zones map the absolute macro boundaries for the upcoming week based on the structural mathematical cluster:
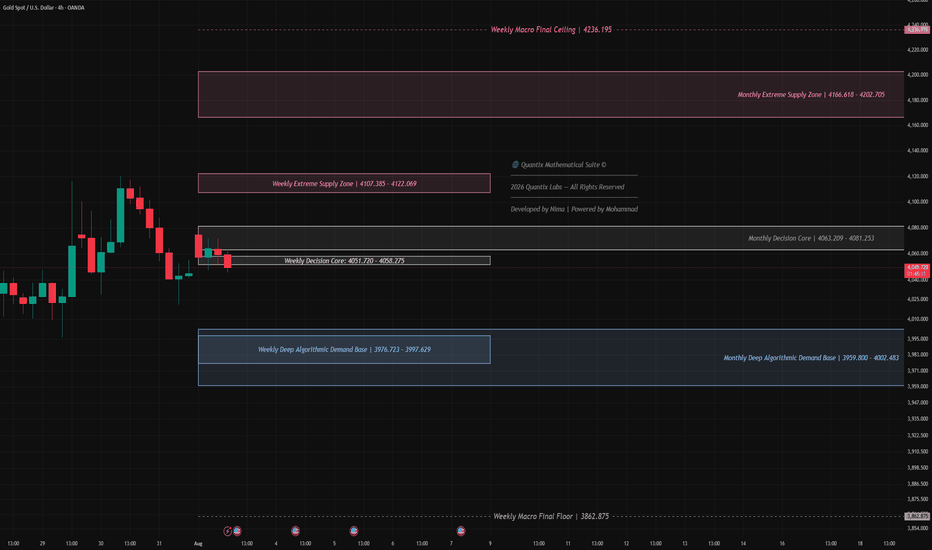
🔴 Macro Final Ceiling: 4236.195
The absolute mathematical maximum upward limit for the current weekly cycle.
🔴 Extreme Overhead Supply: 4107.385 – 4122.069
The ultimate defensive wall for the bears. This dense algorithmic band encompasses the physical weekly high (4120.495) alongside upper mathematical expansion boundaries (4111.755, 4113.607, and 4122.069). This acts as the primary institutional distribution zone preventing further altitude.
🔘 Weekly Decision Core: 4051.720 – 4058.275
The critical macro center of gravity. This tightly packed equilibrium band contains central mathematical nodes (4053.905, 4054.680) and the 50% structural median (4058.275). With the weekly close (4045.165) sitting just below this core, it currently acts as the primary directional threshold.
🔵 Deep Algorithmic Demand Base (Discount Zone): 3976.723 – 3997.629
The primary downside safety net. This cluster aligns directly with the weekly physical low (3996.055) and deep lower mathematical bounds (3976.723), marking the origin of the previous institutional liquidity sweep.
⚫ Macro Final Floor: 3862.875
The absolute mathematical safety net for the current weekly structure.
⚖️ Order Flow & Trade Scenarios
Macro Strategy Bias: Neutral / Volatile Consolidation
Due to the heavy rejection from both extremes, the overarching bias is strictly neutral, demanding patience around the central core:
🟢 Bullish Scenario (Core Reclamation):
For buyers to regain structural control, price action must conquer and establish a firm close above the 4058.275 upper boundary of the decision core. Success here will neutralize immediate bearish pressure and open the trajectory for a renewed attack on the 4120.495 highs.
🔴 Bearish Scenario (Breakdown & Retest):
As long as the market remains compressed below the 4051.720 – 4058.275 core, sellers maintain a slight immediate edge. If selling pressure forces a confirmed penetration below the immediate 4039.443 mathematical threshold, it will trigger a deeper structural drop directly targeting a retest of the 3996.055 physical floor and the deeper demand base.
Trade Safe and follow the structure.
◈ Quantix Labs