
Week 32 of 52 LOW The $200 Test—Bargain or Breakdown?
 LOW
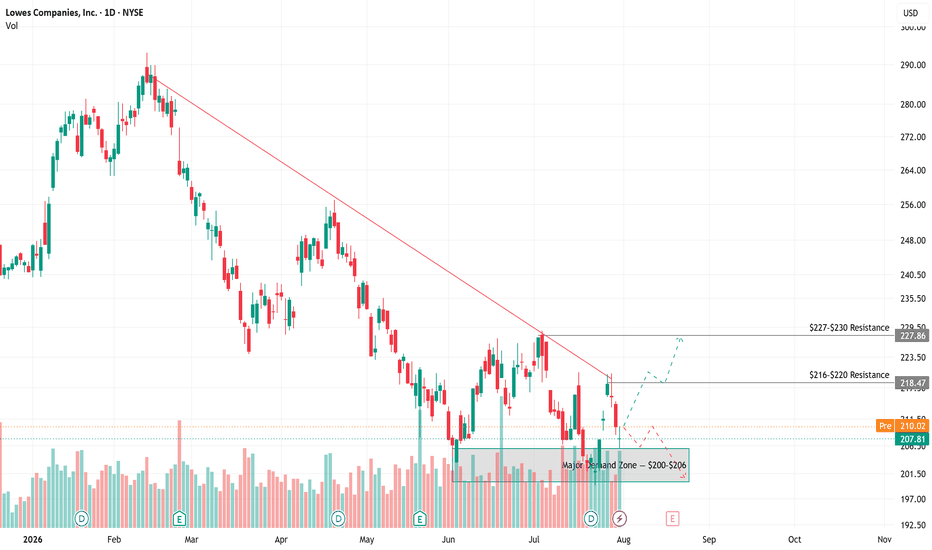
has lost nearly 30% from its January high, but the drop itself is not the most important part of this chart. The real story is where the selling has stopped.
LOW
has lost nearly 30% from its January high, but the drop itself is not the most important part of this chart. The real story is where the selling has stopped.
LOW is back around the $200–$206 zone, the same area where buyers stepped in several times during 2025. That makes the current level worth watching, especially after such a large correction.
Still, I would not call this a confirmed bottom yet.
The stock has been making lower highs since trading near $290, and every bounce has eventually been sold. The latest recovery failed around $227, so sellers still have control of the bigger trend.
For now, everything comes down to $200.
If this zone holds, LOW could bounce toward $217–$220. That is the first real test. A move above that area, together with a break of the downtrend line, would make the chart look much healthier.
After that, the next levels would be around $228–$230, followed by $240.
The risk is that LOW has already tested this support several times. Every new test can weaken the level. If the stock closes clearly below $200, the next stop could be around $192–$195, and possibly the high $180s if selling gets stronger.
At this price, an aggressive investor could start with a small position, knowing the trend is still bearish. A safer entry would come after LOW recovers $220 and shows that buyers are finally taking control.
Lowe’s is still a solid company, but a good company does not always mean a good entry.
$200 is the opportunity.
$220 is the confirmation.
Below $200, the setup starts to break.
This idea is for educational purposes only and is not financial advice.

