
Nvidia Is -15% Since May. Can It Hold This Key Support Level?
Nvidia
 NVDA
has been the star for years of semiconductor stocks, a group that's gotten absolutely smoked of late. The chip-design firm has fallen some 15% since hitting a $236.54 all-time high in May. Let's see what Nvidia's chart and fundamentals can tell us.
NVDA
has been the star for years of semiconductor stocks, a group that's gotten absolutely smoked of late. The chip-design firm has fallen some 15% since hitting a $236.54 all-time high in May. Let's see what Nvidia's chart and fundamentals can tell us.
Nvidia's Fundamental Analysis
Wall Street expects NVDA, which has been the unofficial engine of artificial intelligence, to release fiscal Q2 results in late August. (Nvidia is traditionally the last of the mega-cap tech names to release numbers, usually as earnings season is winding down.)
The Street expects CEO Jensen Huang's firm to report another strong quarter, with analysts' consensus estimate looking for $2.08 in adjusted earnings per share on more than $91.8 billion of revenue.
If realized, those numbers would represent a 98.1% rise from the $1.05 in adjusted EPS that Nvidia reported for the year-ago period, while reflecting 96.5% in year-over-year sales growth.
In fact, 33 of the 40 sell-side analysts that I know of who cover NVDA have increased their earnings estimates since the period began. (Three analysts have reduced their numbers, while four have left their estimates unchanged.)
Nvidia's Technical Analysis
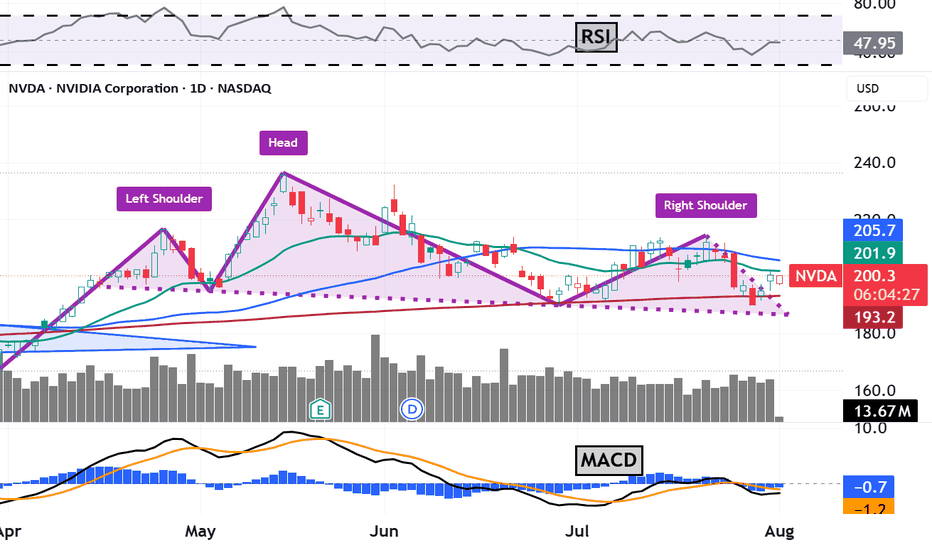
Now let's go to NVDA's chart going back some four months and running through Thursday afternoon (July 30):

The stock is now testing its 200-day Simple Moving Average (or "SMA") from above.
Marked with a red line at $193, Nvidia has dropped below this line more than once in recent days. (The stock traded at $198.60 pre-market Monday.)
A definitive cross below the 200-day line would force many professional fund managers to make a decision on whether to defend the stock or reduce long-side exposure.
Although I'm long the stock, I'm less than confident in its short-term performance at this time.
The head-and-shoulders pattern bears a $190 pivot, which is the low of the neckline. However, I would think that the 200-day line might matter more to professional managers. (The two lines aren't that far apart.)
Moving on to the other technical indicators above, Nvidia's Relative Strength Index (marked "RSI" at the chart's top) has been weakening, but is hanging in better than I would have expected.
Meanwhile, the stock's daily Moving Average Convergence Divergence indication (or "MACD," denoted by blue bars, a black line and a gold line at the chart's bottom) is bearish looking, but not terribly so.
For example, the histogram of Nvidia's 9-day Exponential Moving Average (or "EMA," marked with blue bars) has just barely moved into negative territory.
Similarly, the 12-day EMA (the black line) has dropped just a bit below the 26-day EMA (the gold line), while both lines have moved only a little under the zero-bound. These are all bearish signals, but none of them are especially strong.
My last thought? How NVDA fares might depend on whether or not professionally managed money defends what might be a crowded long position at Nvidia's 200-day SMA, its last key support level. Things would get risky if Nvidia definitively cracks its 200-day SMA.
(Moomoo Technologies Inc. Markets Commentator Stephen "Sarge" Guilfoyle was long NVDA at the time of writing this column.)
This article discusses technical analysis, other approaches, including fundamental analysis, may offer very different views. The examples provided are for illustrative purposes only and are not intended to be reflective of the results you can expect to achieve. Specific security charts used are for illustrative purposes only and are not a recommendation, offer to sell, or a solicitation of an offer to buy any security. Past investment performance does not indicate or guarantee future success. Returns will vary, and all investments carry risks, including loss of principal. This content is also not a research report and is not intended to serve as the basis for any investment decision. The information contained in this article does not purport to be a complete description of the securities, markets, or developments referred to in this material. Moomoo and its affiliates make no representation or warranty as to the article's adequacy, completeness, accuracy or timeliness for any particular purpose of the above content. Furthermore, there is no guarantee that any statements, estimates, price targets, opinions or forecasts provided herein will prove to be correct.
Moomoo is a financial information and trading app offered by Moomoo Technologies Inc. In the U.S., investment products and services on Moomoo are offered by Moomoo Financial Inc., Member FINRA/SIPC.
TradingView is an independent third party not affiliated with Moomoo Financial Inc., Moomoo Technologies Inc., or its affiliates. Moomoo Financial Inc. and its affiliates do not endorse, represent or warrant the completeness and accuracy of the data and information available on the TradingView platform and are not responsible for any services provided by the third-party platform.
