Orient Electric: Multi-Year Downtrend Nearing a Breakout?
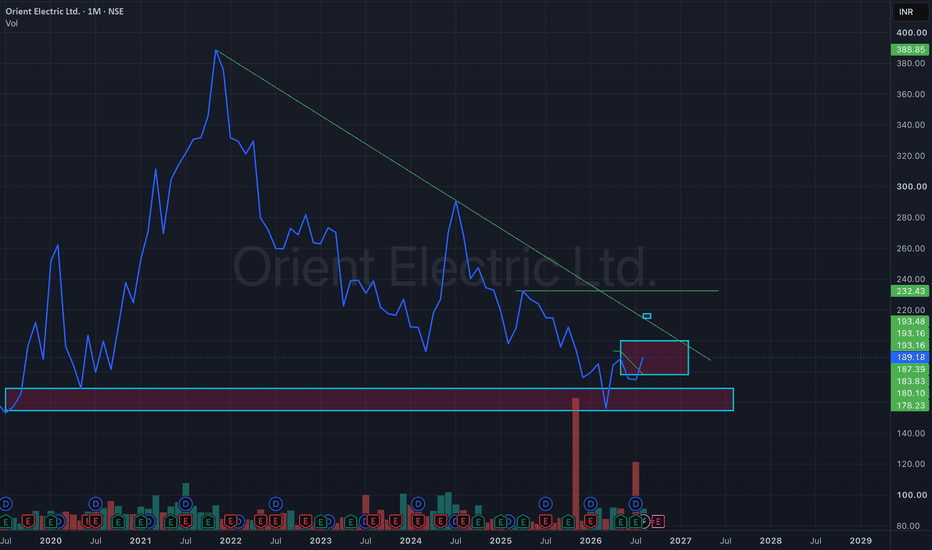
After years of trading under a persistent descending trendline, Orient Electric is showing early signs of a structural reversal on the monthly timeframe.
📊 Technical Observations
✅ Price has reacted strongly from a long-term demand zone around ₹150–170.
✅ Buying pressure has increased after defending this support.
✅ Price is approaching a multi-year descending trendline that has capped rallies since 2022.
✅ Momentum is improving, suggesting accumulation may be underway.
📍 Key Levels
Demand Zone: ₹150–170
Immediate Support: ₹180–185
Breakout Zone: ₹195–205
🎯 Bullish Scenario
A decisive monthly close above the descending trendline and the ₹200 resistance zone could confirm a long-term trend reversal.
If the breakout is sustained, the next upside objectives lie near:
🎯 Target 1: ₹230–235
🎯 Target 2: ₹270–290
🎯 Target 3: ₹330–350
⚠️ Risk
As of now, the breakout is not confirmed. A rejection from the trendline could lead to another test of the support zone. Waiting for confirmation generally offers a better risk-to-reward setup than anticipating the move.
Conclusion
The chart is entering a decisive phase. A successful breakout above the long-term trendline could mark the beginning of a new primary uptrend, while failure to break may keep the stock in its broader corrective structure. Patience and confirmation remain key.