NQ Wk 32-33 | 1hr Chart
E-mini Nasdaq-100 Futures CME_MINI_DL:NQ1!
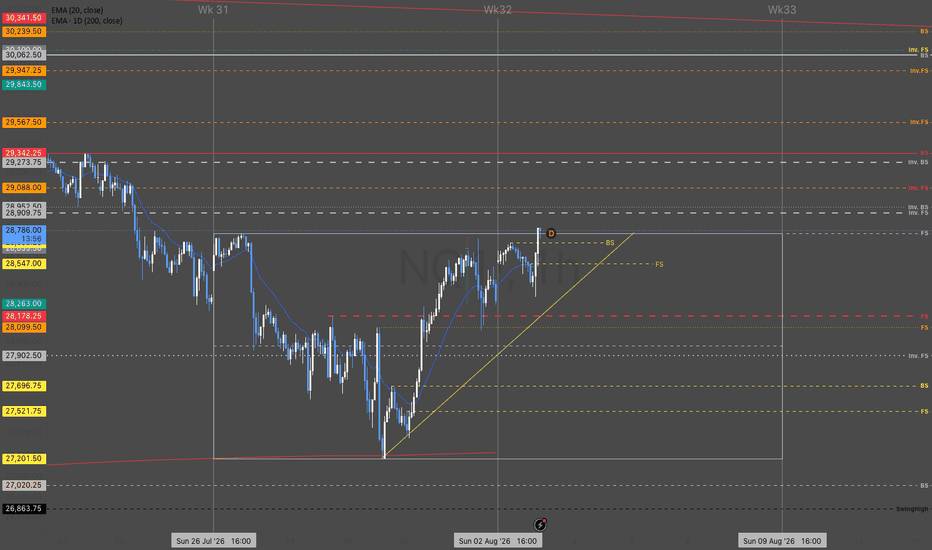
If you zoom out you can see the full chart breakdown from yearly down to 1hr.
Price action is breaking over last week's high. There is a 1hr support range just below price with a 40 degree accumulation trend. If it breaks the vertex of the angle is protected by another hourly support range ($27,696.75- $27,521.75)
Above price action are mainly weekly, and 4hr resistance levels.