HOOD: Oversold Bounce Setup at Multi-Level Support
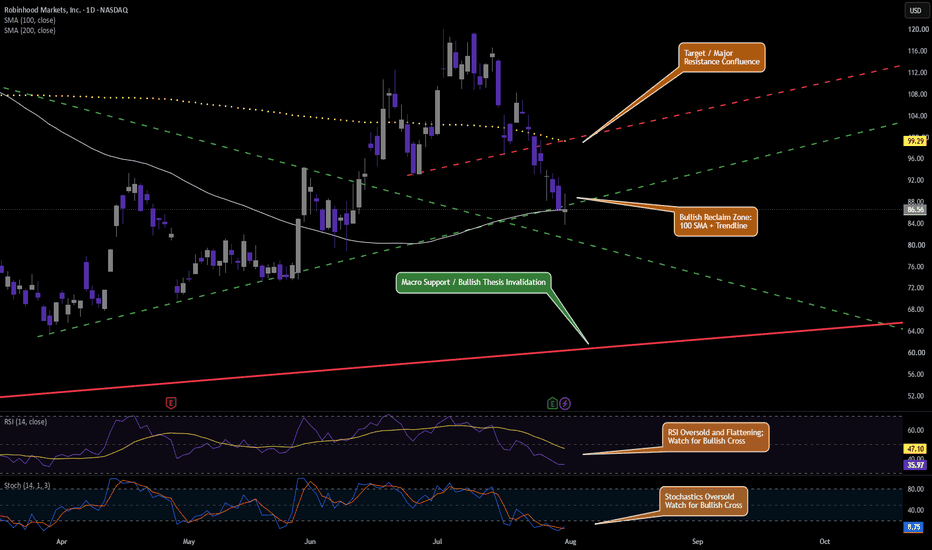
Robinhood is sitting at an interesting support area after a sharp pullback.
Price is testing a bullish reclaim zone where several technical factors are clustering:
the 100 SMA
a rising trendline
the descending green dashed trend line, which may now be acting as support / confluence
Momentum is also worth watching closely. RSI and stochastics are oversold, with RSI flattening and both indicators potentially setting up for a bullish cross.
In addition, there are developing CCI and volume divergences on the mid time frames, which may suggest downside momentum is beginning to weaken. I would still treat those as developing signals rather than full confirmation.
Bullish setup
The bounce thesis improves if price can:
hold this confluence area,
reclaim the 100 SMA + trendline zone,
and confirm with improving momentum
If that happens, the next upside objective would be the major resistance confluence above, which looks like a logical profit-taking area.
Risk / invalidation
If price fails to hold this support cluster, the next major level below is the macro support / bullish thesis invalidation zone. Losing that area would weaken the bounce idea and suggest the pullback is still unfinished.
Current read
This is still a watch-for-confirmation setup, not a blind long.
The key idea is that HOOD is testing a stacked support area while momentum becomes stretched and some mid-timeframe divergence begins to develop. If bulls can defend this zone and reclaim nearby structure, a bounce toward overhead resistance becomes more likely.
Educational analysis only, not financial advice.