
KGEN ' Symmetrical / Falling Wedge '
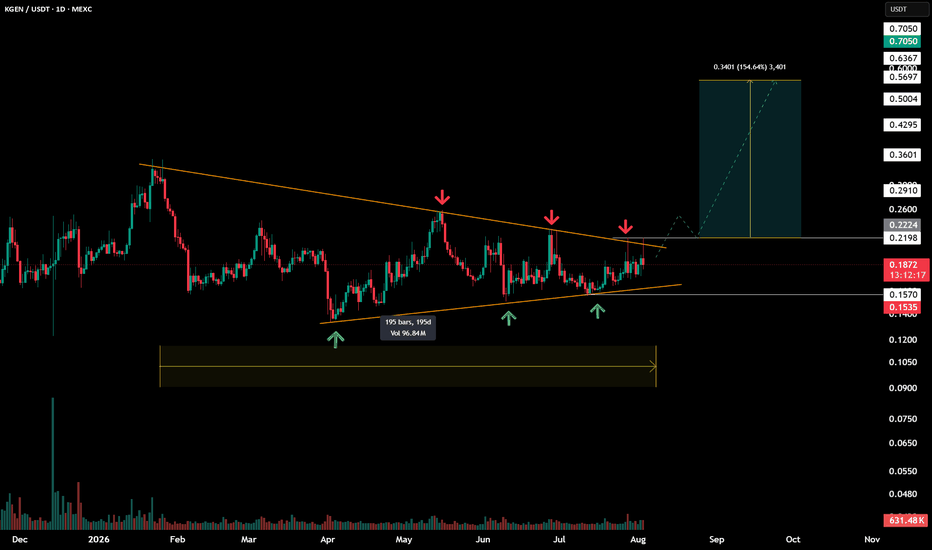
195-Day Wedge Compression: Big Breakout Loading?
Overview
Price has been consolidating inside a massive Symmetrical / Falling Wedge pattern for the past 195 days. We are now approaching the apex of this compression, where a major directional move typically unfolds.
Technical Breakdown
Strong Confluence: The upper resistance (red arrows) and lower support (green arrows) have been tested multiple times over the last six months, validating this market structure.
Key Support Zone: The $0.1535 – $0.1570 range continues to act as a rock-solid floor for buyers.
Breakout Trigger: The main hurdle for the bulls lies between $0.2000 and $0.2200. A daily candle close above this level confirms the breakout.
Trade Plan & Targets
Confirmation Entry: Wait for a breakout and retest of the $0.2200 resistance-turned-support zone.
Upside Target: The measured move of the pattern points toward a potential ~150%+ rally, targeting the major resistance at $0.7050.
Target 1: $0.3600
Target 2: $0.5000
Final Target: $0.7050
Risk Management
Invalidation / Stop Loss: A daily close below the $0.1535 support level invalidates this bullish scenario.
Disclaimer: This analysis is for educational purposes only and not financial advice. Always manage your risk!
