JTO is still in a corrective structure (8H)
JTO / TetherUS PERPETUAL CONTRACT BINANCE:JTOUSDT.P
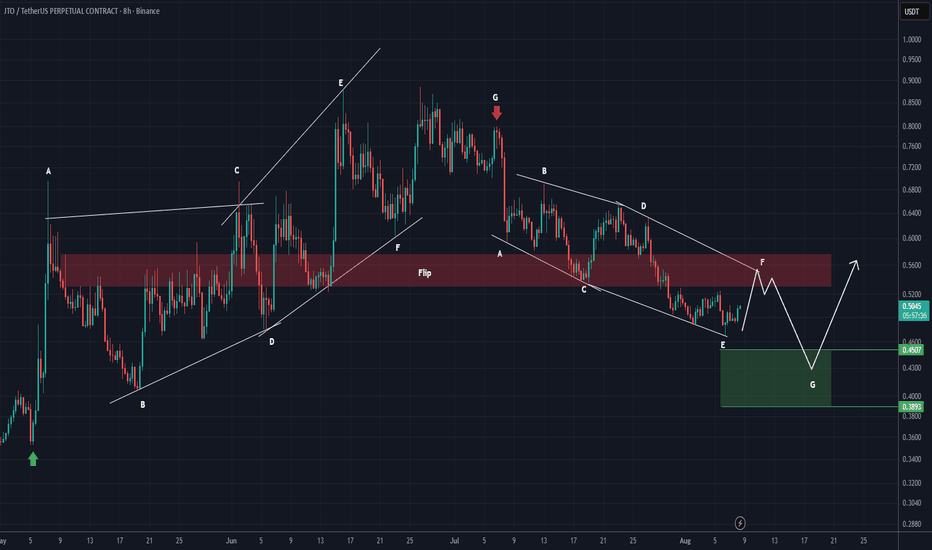
The bullish phase of JTO started from where we placed the green arrow on the chart. From where we placed the red arrow, the bullish phase ended and the bearish phase began.
It appears that the bearish phase is forming a Diametric structure, with price currently in wave F.
We expect price to be rejected from the red supply zone and drop toward the green zone to complete wave G, followed by another recovery.
The red zone is an important trading area that has been lost.
Let’s see what happens.
If you have a symbol you want analyzed, first hit the like button and then comment its name so I can review it for you.
Do you think JTO is bullish?