Fitaihi Holding Group : Triple Confluence in Play 🇸🇦
 4180
4180
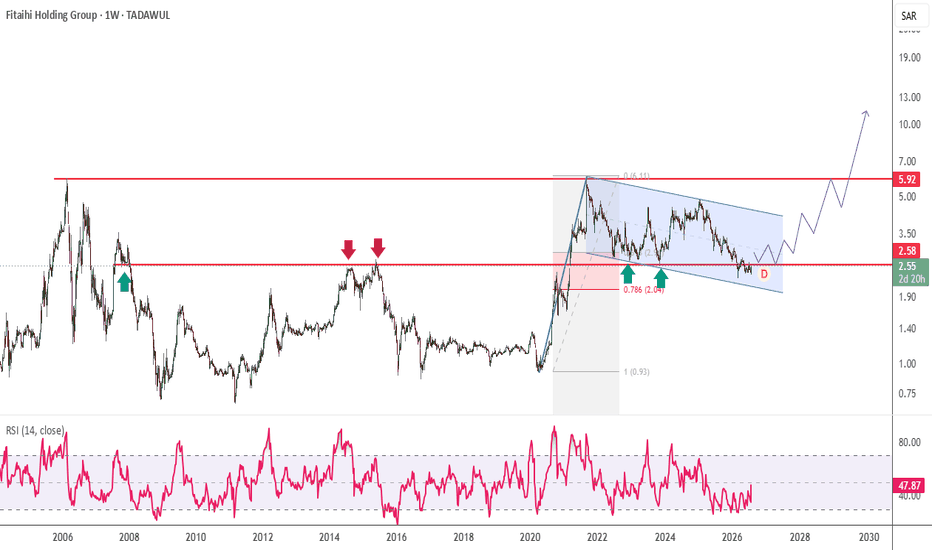
🚀 Triple Confluence in Play: Is This the Next High-Probability Reversal Zone? 🇸🇦
The stock is approaching a high-confluence technical area, where multiple bullish signals are beginning to align.
While the broader trend still requires confirmation, the current setup deserves a place on every swing trader's watchlist.
🔍 Three Technical Confluences Supporting the Bullish Case
📌 1. Bull Flag Formation
Price continues to develop a Bull Flag, a classic continuation pattern that often appears before the next impulsive move.
A confirmed breakout from this structure could attract fresh buying momentum.
📌 2. Deep Fibonacci Discount Zone
The stock is trading within the 0.618–0.786 Fibonacci retracement zone—an area widely regarded as a high-probability institutional accumulation zone.
Historically, this range has often produced strong rebounds when supported by bullish price action.
📌 3. Weekly Reversal Zone at 2.60
The 2.60 price level has repeatedly acted as a major weekly reversal point, making it one of the most significant support zones on the chart.
The convergence of historical support, Fibonacci retracement, and the flag pattern strengthens the technical importance of this area.
📊 RSI: Momentum Confirmation Still Needed
Momentum is also beginning to improve.
The Relative Strength Index (RSI) is approaching the 50 level, which often marks the transition from bearish to bullish momentum.
👀 Key RSI Trigger:
✅ A sustained move above 50 would indicate improving buying strength.
🚀 A breakout into the 50–60 RSI zone would provide stronger confirmation that bulls are regaining control and that momentum is shifting in favor of an upside continuation.
📈 My View
This is one of those setups where confluence matters more than any single indicator.
✅ Bull Flag pattern developing.
✅ Trading inside the 0.618–0.786 Fibonacci discount zone.
✅ Strong weekly support at 2.60.
✅ RSI approaching a bullish momentum shift.
Rather than predicting the breakout, I'd prefer to wait for price confirmation and RSI strength before increasing exposure.
If buyers successfully defend this zone and momentum confirms, this setup could evolve into a high-probability swing trading opportunity.
Will this triple-confluence zone trigger the next bullish breakout, or will sellers defend the range once again? Share your technical outlook below! 👇
#Tadawul #SaudiStockMarket #SaudiStocks #TASI #SaudiInvesting #SaudiTrading #SaudiInvestors #KSAStocks #SaudiEquities #MiddleEastMarkets #GCCMarkets
#TechnicalAnalysis #TradingView #PriceAction #BullFlag #ChartPattern #Fibonacci #FibonacciRetracement #DemandZone #RSI #MarketStructure #SupportAndResistance #SwingTrading #BreakoutTrading #TrendFollowing #MomentumTrading #ChartAnalysis #TradingIdeas #StockAnalysis #BullishSetup #RiskManagement
#WiSHFundManagement