BHARATWIRE — CLEAN BALANCE SHEET, SHRINKING TOP LINE, AND A SHAR
BHARATWIRE — CLEAN BALANCE SHEET, SHRINKING TOP LINE, AND A SHAREHOLDING TABLE THAT LIES
NSE:BHARATWIRE | Weekly | Bias: Watchlist. Good business quality, poor location, deteriorating growth
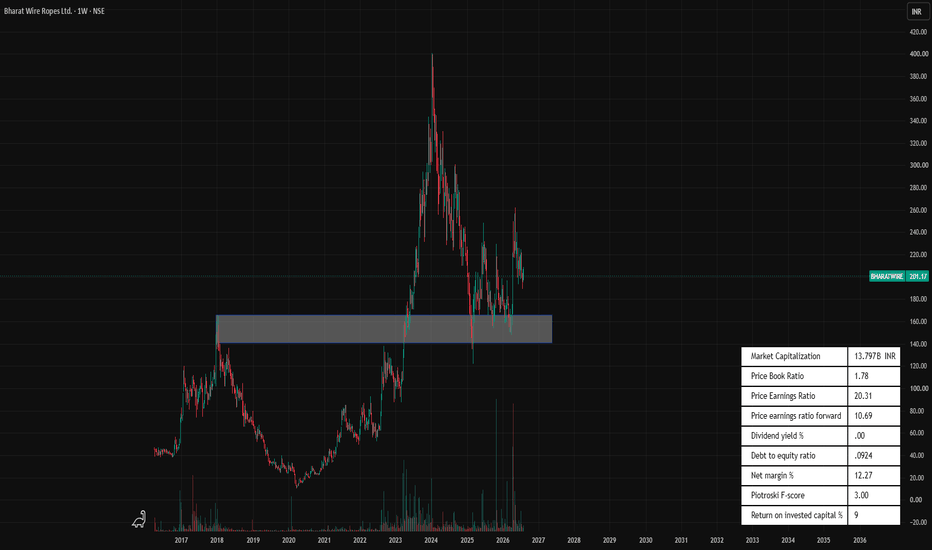
Price 201.17 | Week: O 197.48 / H 208.58 / L 197.48 / +2.12% / Vol 943.88K | Market cap Rs 1,380 Cr
THE SETUP
Bharat Wire Ropes is a genuine turnaround that already happened. Losses of Rs 45, 61 and 17 Cr across FY19-FY21, interest costs peaking at Rs 89 Cr, and then a resolution: interest expense down to Rs 10 Cr TTM, debt-to-equity at 0.09, and four consecutive profitable years. That work is done and the market paid for it — the stock ran from roughly 20 in 2020 to about 400 by early 2024.
Since that peak the chart has been a wide, violent range: down to roughly 125 in early 2025, back to about 250, down to the 160s, up to roughly 265 in early 2026, and now 201.17. Two years of lower highs against a rising floor.
The grey band at roughly 140-165 is the structure that matters. It was the 2018 high, it was the 2023 breakout shelf, and it has been defended repeatedly since. That band is the idea. Price at 201 is not.
STRUCTURE I'M WATCHING
All-time high ....... 400 ...... Early 2024. Requires a full growth re-rating.
Resistance 2 ........ 300 ...... Mid-vacuum from the 2024 decline.
Resistance 1 ........ 250 – 265 . The 2025 and 2026 highs. The level that matters.
Current ............. 201.17 ... Mid-range. Poorest risk/reward in the structure.
Band top ............ 165 ...... Top of the support shelf. Where it gets interesting.
Support band ........ 140 – 165 . The 2018 high and 2023 breakout zone. Repeatedly defended.
Invalidation ........ below 138 . Band failure.
Cycle low ........... 125 ...... The early-2025 low.
This week opened at its low of 197.48, ran to 208.58, and settled back to 201.17. A green week, but it gave up more than half the range. Not a bar that demands action.
WHAT THE CHART IS TELLING ME
- The 140-165 band is the real level. Three separate roles across eight years — resistance, breakout shelf, then support — is about as validated as a smallcap level gets.
- Higher lows against lower highs. 125 then roughly 160 on the downside; 400 then 265 on the upside. That is a contracting range, and contracting ranges resolve — but they do not tell you which way.
- Mid-range offers no edge. From 201 with invalidation at 138, risk is roughly 31% for about 32% to the first objective at 265. Barely 1:1. From 165 the same 138 stop is roughly 16% risk for 60% upside — closer to 3.7:1. Same idea, same target, entirely different trade.
- Liquidity is thin. Under a million shares a week on a Rs 1,380 Cr company means impact cost is real. Size and exit planning matter more here than on a large cap.
FUNDAMENTAL BACKDROP — THE BALANCE SHEET IS FIXED, THE INCOME STATEMENT IS NOT
The deleveraging is genuine and complete:
Interest cost ...... Rs 89 Cr (FY20) to Rs 10 Cr (TTM)
Debt / equity ...... 0.09 — effectively debt-free
FCF ................ Rs 66 Cr in FY26, up from Rs 10 Cr in FY25
CFO / OP ........... 79% in FY26, versus 52-56% in FY24-25 — cash conversion improving
Price / book ....... 1.70 — undemanding
The income statement is the problem:
Sales .............. 622 (FY24) > 619 (FY25) > 591 (FY26) > 579 (TTM). Declining three years running
Operating profit ... 164 (FY24) > 132 > 131 > 126 (TTM)
Net profit ......... 96 (FY24) > 72 > 72 > 69 (TTM)
EPS ................ 14.16 (FY24) > 10.58 > 10.57 > 10.07 (TTM)
OPM ................ 26% (FY24) > 22% (TTM)
3-year sales CAGR .. 0%. TTM sales growth -8%
ROE ................ 24% (5yr) > 21% (3yr) > 12% (last year)
Piotroski F-score .. 3 of 9
Dividend ........... Nil, every year on record
That ROE compression from 24% to 12% is the honest summary. This company earned its re-rating between FY21 and FY24 and has been giving it back since.
DATA FLAG: the forward P/E of 10.69 against a trailing 20.31 implies earnings roughly doubling. With sales down 8% TTM and a three-year sales CAGR of zero, that estimate deserves scepticism. Smallcap forward estimates rest on thin coverage. Find the capacity or order-book basis for it before you trust it — if there isn't one, the stock is on 20x, not 10.7x.
THE SHAREHOLDING SIGNAL — READ IT CAREFULLY
The Jun 2026 quarter shows DII holding jumping from 0.32% to 19.00%. That looks like a landmark institutional entry. It mostly is not.
Authum Investment and Infrastructure held 18.59% classified under Public in Mar 2026 and appears at 18.78% under DIIs in Jun 2026. Public holding falls from 54.00% to 37.68% in the same quarter. That is one existing block being recategorised, not bought. The real change in that stake is roughly +0.19pp.
What IS new and genuinely worth noting:
- Lloyds Metals & Energy at 3.35% and Lloyds Enterprises at 2.00% appear for the first time — roughly 5.35% taken by a listed industry player. Strategic money entering a small competitor's cap table is a signal worth watching, and it is the most interesting line in the whole table.
- FIIs halved, 4.42% to 2.06%, in the same quarter. Foreign money left while strategic money arrived.
- A large individual public holder cut from roughly 7.6% to 5.0% in Dec 2025.
- Promoter holding is static at 41.27% and has not moved in five quarters. It is also low versus the sector median of roughly 60%.
- Shareholder count is flat to slightly falling at around 31,600.
Net read: a concentrated register with a dominant non-promoter block, low promoter skin in the game, foreign investors exiting, and a strategic industrial buyer arriving. Interesting, but not the clean institutional-accumulation story the headline row suggests.
FUTURE PLANS — WHAT THE COMPANY IS BUILDING
(Framework as of my information — verify against the latest annual report, investor presentation and exchange filings.)
- Capacity utilisation and value-added mix. The core lever is shifting output from commodity ropes toward higher-realisation ropes for elevators, cranes, offshore, mining and oil and gas. OPM at 21-22% is already well above the peer median of 10.25%, which suggests the mix work has partly landed.
- Export expansion. Wire rope is an exportable, specification-driven product. Growing overseas share is the most credible route back to top-line growth given a flat domestic run rate.
- Import substitution. A structural opportunity in India where higher-specification ropes were historically imported.
- Balance-sheet-funded growth. With debt-to-equity at 0.09 and FCF at Rs 66 Cr, expansion no longer requires the leverage that nearly destroyed the company. Capex has been modest — Rs 25, 62 and 31 Cr across FY24-FY26.
The strategic tension: margins and cash conversion are improving while revenue shrinks. That is a company optimising rather than growing. Optimisation has a floor; it cannot produce a doubling in earnings on its own. The forward multiple needs volume, and volume is what is missing.
COMPETITIVE LANDSCAPE — THE PEER TABLE IS UNFLATTERING
The direct comparison is Usha Martin, the dominant listed Indian wire rope player:
Bharat Wire Usha Martin
Market cap (Cr) 1,380 15,696
OPM % 21.78 20.03
ROCE % 12.32 19.47
P/E 19.97 28.80
Price / book 1.70 4.75
Qtr sales growth % -7.95 +16.44
Op profit growth % -2.86 +30.78
5-year return % 20.43 50.01
Debt / equity 0.09 0.07
Bharat Wire earns a slightly better operating margin on a fraction of the scale — that is a real achievement. But it converts capital far worse (ROCE 12.32 versus 19.47), and it is shrinking while its direct competitor grows sales at 16% and operating profit at 31%.
That distinction is decisive. This is not a sector downturn dragging everyone down. The category is growing and Bharat Wire is not participating. The valuation discount — 1.70x book against 4.75x — is therefore substantially earned rather than an obvious mispricing.
Against the broader 82-company peer set, Bharat Wire screens well on margin (21.78 vs 10.25 median) and leverage (0.09 vs 0.27), poorly on growth, and is the only name in the top eight paying no dividend. Promoter holding of 41.27% sits well below the 59.77% median.
Wider competition includes global rope manufacturers and, more persistently, imported product. Pricing pressure from cheap imports is the recurring threat to a margin profile that is currently this company's main selling point.
MACRO LENS
- Steel wire rod input costs. The dominant margin variable. OPM falling from 26% to 22% is consistent with input cost pressure, realisation pressure, or both. Steel price direction moves this P&L more than anything else on this list.
- Indian infrastructure and capex cycle. End demand comes from construction, cranes, ports, mining, elevators and offshore. Government capital expenditure and the real-estate cycle are the demand engine — this is a leveraged play on India's industrial cycle, not a defensive holding.
- Import competition and trade policy. Global steel overcapacity keeps pressure on domestic pricing. Anti-dumping and safeguard measures are a live policy variable that can swing margins in either direction.
- Currency. A weaker rupee helps export realisations and hurts imported input costs. Direction matters to the export growth plan specifically.
- Interest rates now matter far less. At 0.09 debt-to-equity with Rs 10 Cr of interest cost, the rate cycle has stopped being a solvency question. That is a meaningful change from three years ago.
- Smallcap liquidity regime. Indian smallcap valuations move with domestic flows. When smallcap flows reverse, thin names re-rate downward regardless of fundamentals.
INVALIDATION
A decisive weekly close below 138 breaks the 140-165 band that has held for years and puts the 125 cycle low back in play. On a Piotroski score of 3 with declining sales, I would not average into that break.
Softer warning: repeated rejections in the 250-265 zone while the band gets retested means the range is compressing toward a downside resolution.
RISKS WORTH NAMING
- Growth has stalled, not slowed. Three years of zero sales CAGR and -8% TTM. Everything else depends on this reversing.
- Losing share to a direct competitor. Usha Martin growing 16% while this shrinks 8% is company-specific, not cyclical.
- The forward multiple may be fiction. 10.69x requires an earnings double that current trends do not support.
- Concentrated register. A single non-promoter block near 19% and promoter holding at 41.27% means governance and exit risk both concentrate.
- Thin liquidity. Under a million shares a week. Exits in a drawdown will be expensive.
- No dividend, ever. Zero payout across the entire record. No income support at the lows.
- Input cost volatility on a business whose main attraction is currently its margin.
TRADE PLAN
Value entry ........ 145 – 168 on a weekly hold with volume
Breakout entry ..... Weekly close above 265
Invalidation ....... Weekly close below 138
Target 1 ........... 265
Target 2 ........... 300
Geometry ........... Roughly 1:1 from 201. Roughly 3.7:1 from 165. Wait for the band
Sizing ............. Thin smallcap. Position for illiquidity, not just volatility
No position at 201. The balance sheet earns this a watchlist slot; the growth trend does not earn a market order.
The thing to monitor is quarterly sales turning positive. That single line item is what would convert this from a value trap into a re-rating.
Not financial advice — my own chart and filings interpretation, shared for discussion. Figures are read from public data panels; verify against the company's filings before acting. Forward estimates on smallcaps are unreliable. Do your own research and manage your own risk.