

XAUUSD — Gold at the top of its range
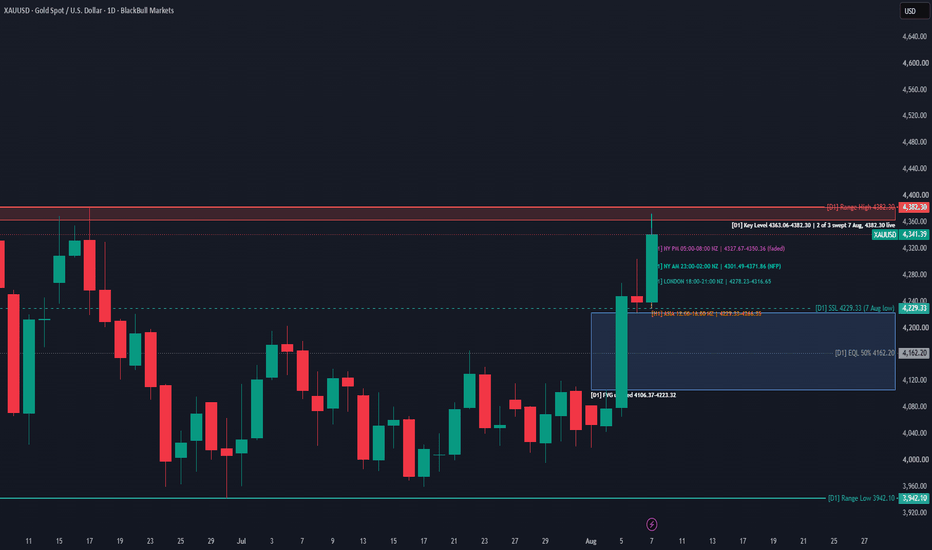
 XAUUSD
closed the week at 4341.39, near the top of the range it has traded inside since late June. This is a map of where price sits and what would have to happen for the picture to change. It is not a call, and the most likely outcome I can see is no trade at all.
XAUUSD
closed the week at 4341.39, near the top of the range it has traded inside since late June. This is a map of where price sits and what would have to happen for the picture to change. It is not a call, and the most likely outcome I can see is no trade at all.
The range. I am working with 3942.10 – 4382.30. The high was set on 17 June, the low on 30 June, and price has not traded outside either boundary in the seven weeks since. That makes them the live edges — a boundary matters when price is still respecting it, not because it was important once.
Equilibrium sits at 4162.20, the midpoint. Price at 4341.39 is 90.7% of the way up the range. That is deep premium, and it is the single most important thing on the chart: in a premium, the odds favour sellers, not buyers. A bullish-looking pattern in the upper tenth of a range is not the same trade as the identical pattern near the low.
What happened last week. Price ran from roughly 4019 up into a cluster of old highs at 4363.06, 4369.14 and 4382.30 — three swing highs from 9, 15 and 17 June sitting within about 19 points of each other. Clusters like that hold resting orders, which makes them a magnet.
It reached 4371.86, taking the first two of those three highs, and then closed the week back below the zone at 4341.39.
So the job is two-thirds done. 4382.30 was not touched. That unfinished third level is, to me, the most interesting thing on the chart going into next week.
What is left underneath. There is an unfilled imbalance at 4106.37 – 4223.32, created on 5 August when price left a gap on the way up. Price has not returned to it. Unfilled gaps tend to act as a draw eventually, and it is the first meaningful objective below.
Nearest support levels below current price: 4301.49, then 4229.33.
Three ways next week can go.
One — it takes 4382.30 and holds above. Then the range I have drawn is broken and this whole map needs redrawing rather than defending. I would rather say that in advance than quietly move the line afterwards. Note that even then I would not be buying: on the wider structure price is still not in a discount.
Two — it returns to 4363–4382, takes the last high, and rejects. That completes the sweep of all three levels, and a decisive close back below 4363.06 with real momentum behind it would be the cleanest short this map offers. Targets in that case would be 4301.49, then 4229.33, then the gap at 4223.32.
Three — neither. Price chops between roughly 4301 and 4382 all week and nothing sets up. Flat is a position, and on the evidence this is what I would expect.
Why I am not leaning hard on the bearish case, despite the location.
Three things argue against it, and I would rather publish them than leave them out:
- Friday's daily candle closed up 102 points, with the body making up about 72% of the day's range and only a small upper wick. That is a trend candle, not a rejection candle.
- The late session faded rather than reversed. After the high, price drifted sideways in a narrow range on declining volume. It ran out of buyers; it was not turned around by sellers. Those produce very different Mondays.
- Silver and the dollar both confirm gold. Silver is up about 16% from its own low against gold's 10% — a normal ratio for silver, so it is participating fully, not diverging. The dollar index is sitting at the bottom of its own range. Neither is flashing the non-confirmation you would want before fading a move.
So: the location says sellers, the price action says otherwise, and I am not going to average those two into a position. When the layers disagree, the honest answer is to wait.
One practical note. Next week is heavy — CPI, PPI and Retail Sales all land within the same overnight window from where I trade. Levels reached inside a data release are worth less than levels reached without one, and I treat the minutes around those releases as no-trade time regardless of what the chart is doing.
The level to watch is 4382.30. Above it, this map is wrong and gets rebuilt. Below it, the range is still in charge.
I will follow up at the end of the week with what actually happened against what is written here, including the parts I got wrong.
⚠️ Educational content only. This is not financial advice, not a recommendation, and not a signal service. I am sharing my own chart analysis for discussion and for my own record. Markets repeat tendencies, not guarantees — a structure that held before can fail without warning. Do your own research, manage your own risk, and never risk money you cannot afford to lose.
