ETH/USDT – Bearish Breakdown Below Rising Trendline
Ethereum / TetherUS BINANCE:ETHUSDT
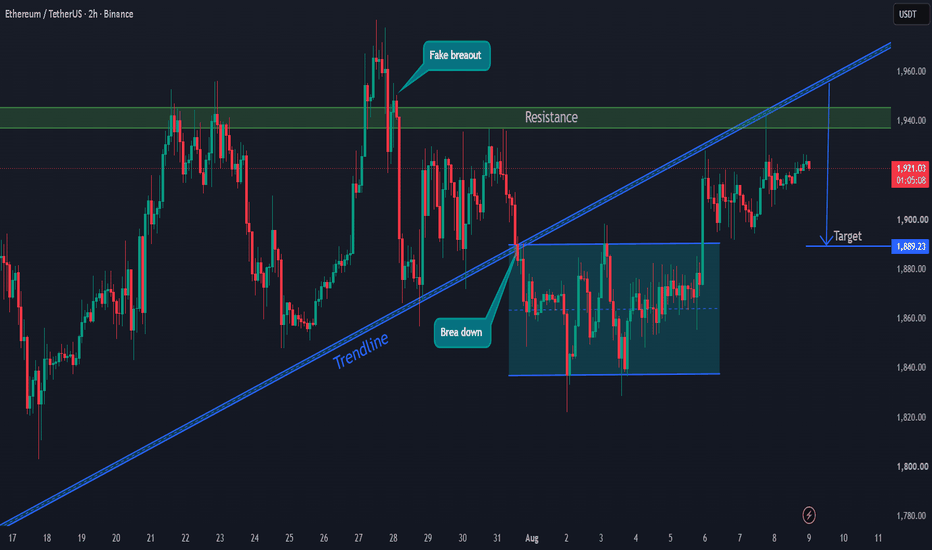
ETH/USDT on the 2H chart shows a clear rejection from the 1,940–1,945 resistance zone after a fake breakout. Price then broke below the ascending trendline, signaling a potential shift toward bearish momentum.
The current structure suggests a possible move lower if resistance around 1,940 continues to hold. The highlighted range indicates consolidation following the trendline breakdown.
🎯 Target: 1,889.23 USDT
🛑 Key Resistance: 1,940–1,945 USDT
📉 Bias: Bearish below resistance
⚠️ A sustained move back above 1,945 could invalidate the bearish setup.