NAS100 — 15M Market Structure Analysis
🔎 Market Structure
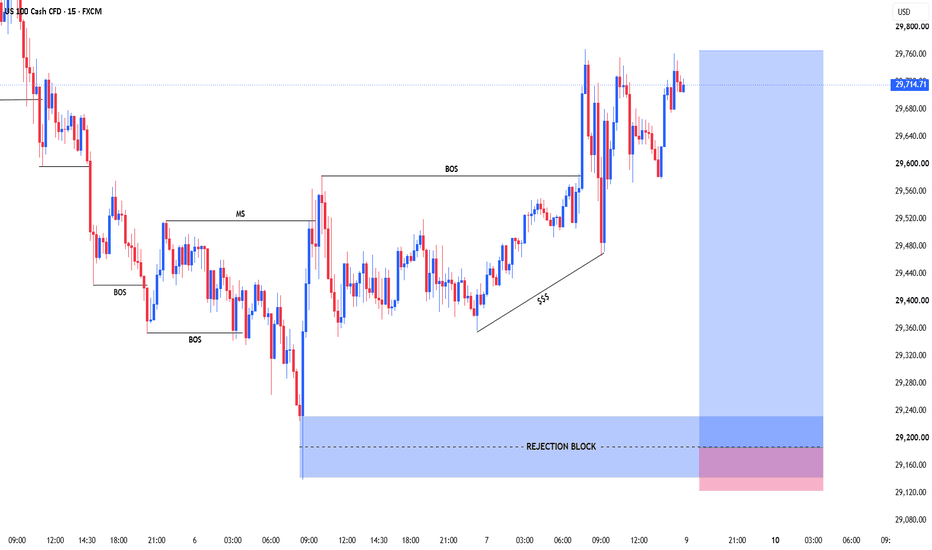
The chart shows a clear recovery from the 29,150–29,230 rejection block, followed by a sequence of higher lows and a bullish Break of Structure (BOS) around the 29,580 area.
Price is currently holding above the broken structure and trading near 29,700–29,750, so the key question is whether this bullish structure can continue or whether price returns to retest lower support.
🟦 Key Zone — Rejection Block
29,150–29,230
This is the major demand/reaction area marked on the chart. The strong displacement away from this zone was followed by the subsequent bullish structure shift.
A future return into this area would be important for observing how price reacts rather than assuming an automatic reversal.
📌 Key Levels
29,700–29,760: Current reaction / local high area
~29,580: Important structural BOS level
29,350–29,450: Intermediate structural support
29,150–29,230: Major rejection block
🟢 Bullish Scenario
If price continues to hold above the 29,580 structural area and develops another higher high, that would support continuation of the current bullish market structure.
🔴 Bearish Scenario
A rejection from the current highs followed by a sustained break below 29,580 could indicate a deeper retracement. In that case, the lower structural areas become relevant for monitoring.
A deeper move toward 29,150–29,230 would represent a significant test of the original rejection block.
⚠️ Invalidation / Structure Change
The bullish thesis becomes weaker if price loses the established higher-low structure and closes decisively below the relevant support levels. The reaction at each level is more important than simply touching it.
📝 TradingView Premium Description
NAS100 15M | Market Structure & Reaction Zones
NAS100 has developed a bullish intraday structure after reacting strongly from the 29,150–29,230 rejection block. Price subsequently formed higher lows and broke above the previous structural resistance near 29,580.
The current area around 29,700–29,760 is being monitored as price approaches the recent highs. Continued acceptance above the structural breakout area would support the continuation scenario, while a breakdown of the established structure could lead to a deeper retracement toward lower support zones.
This analysis focuses on market structure, price action and key reaction areas. It is presented for educational and informational purposes only and does not guarantee any future market outcome.
TradingView specifically recommends that ideas explain the reasoning behind the analysis, rather than functioning as simple buy/sell calls. It also prohibits promotional content, and its publishing guidance says not to post after-the-fact ideas merely to show a profitable move.
#️⃣ Suggested Tags
#NAS100 #US100 #PriceAction #MarketStructure #BOS #TechnicalAnalysis #TradingEducation #IndexTrading