USDJPY 15M: EQH Liquidity Sweep Rejected
Market Thesis:
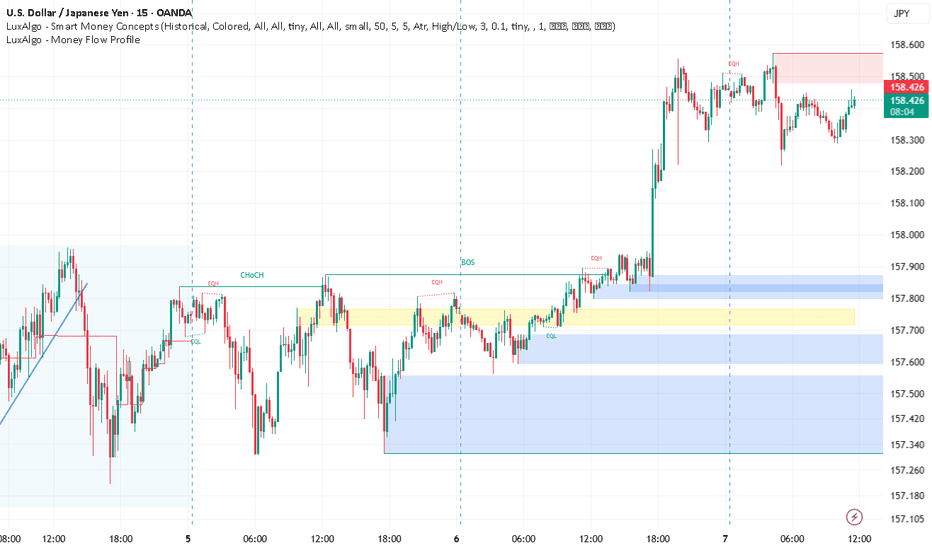
The visible 15-minute structure remains broadly bullish after the BOS around 157.87 and the subsequent impulsive expansion toward 158.55+. However, price has now traded through the visible EQH near 158.50, pushed into the Weak High near 158.58, and rejected sharply. At 158.388, short-term order flow is defensive below the upper liquidity zone, while the deeper bullish structure remains intact unless lower support is lost.
Visible Confluences — 15-Minute Chart
Bullish BOS: approximately 157.87, followed by strong displacement higher.
Upper EQH liquidity: approximately 158.50; price traded above this level before rejecting.
Weak High: approximately 158.58, defining the visible upside liquidity extreme.
Upper red reaction zone: roughly 158.499–158.550, immediately beneath the Weak High.
Current price: 158.388, below profile references at 158.449 and 158.499.
LuxAlgo Money Flow Profile: visible negative flow of -8.359K (29.58%) around the current upper range, supporting the recent selling response.
First blue support zone: approximately 157.792–157.842, directly beneath the prior BOS area.
Positive Money Flow concentration: 11.3K (25.66%) around 157.741, adding confluence to the lower support region.
Deeper blue support: visible around 157.590–157.691.
Strong Low: approximately 157.30, marking the major visible downside liquidity reference.
No labeled 15M CHoCH is currently visible; reversal entries should therefore be confirmed on a lower timeframe rather than anticipated.
Trade Scenarios
Setup 1 — SELL: Upper-Liquidity Retest
Entry Zone: 158.499–158.550
Trigger: Price trades back into the red zone, then prints a 1M/5M bearish CHoCH, decisive rejection, or bearish momentum close back below 158.499.
Stop Loss: 158.590
TP1: 158.388
TP2: 158.297
TP3: 158.196
Logic: The EQH has already been breached and the Weak High area rejected. A controlled retracement into 158.50–158.55 followed by LTF bearish confirmation would offer the cleaner continuation setup. Avoid chasing shorts at current price.
Setup 2 — BUY: Discount Pullback Into Structural Support
Entry Zone: 157.792–157.842
Trigger: Sweep/rejection of the blue zone followed by a 1M/5M bullish CHoCH, strong bullish momentum candle, and preferably a reclaim of 157.842.
Stop Loss: 157.690
TP1: 157.893
TP2: 158.196
TP3: 158.388
Logic: This zone sits beneath the visible bullish BOS and represents the first meaningful structural support on the chart. The setup is valid only if buyers demonstrate clear LTF control inside the zone.
Refinement Tip
For the best Risk/Reward, treat the 15M chart as the directional framework and refine execution on the 1M–5M. Wait for liquidity interaction first, then require an LTF CHoCH, momentum displacement, or decisive rejection candle before execution. The zone identifies the location; the lower-timeframe shift provides the trigger.
⚠️ Disclaimer:
Trading financial markets involves significant risk, and no technical setup carries a guaranteed outcome. This analysis reflects only the market structure, LuxAlgo data, and price information visibly displayed on the provided chart at this moment. It is strictly educational and analytical, not a promise of performance or individualized financial advice. Always apply independent judgment and disciplined risk management.