MESU Aug 6: Bounce to 7774 Before a 7682 Pullback?
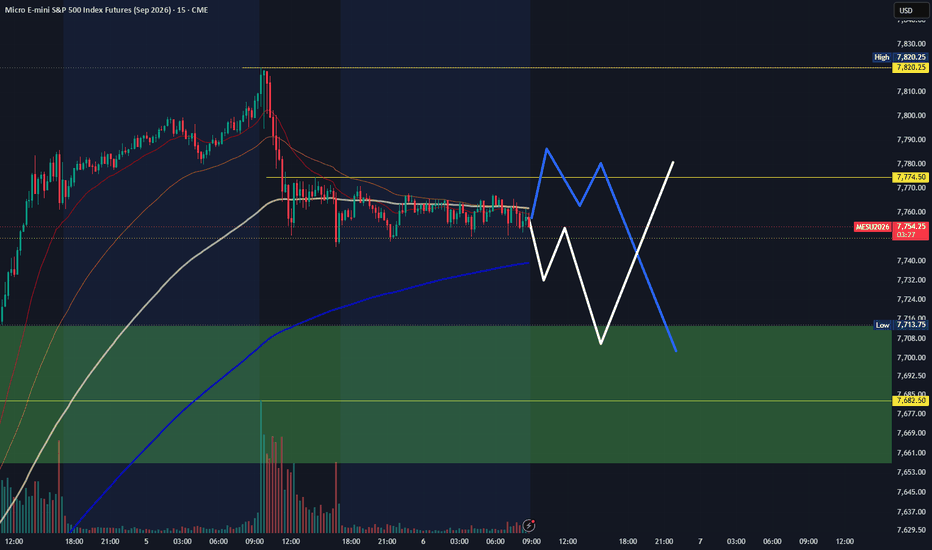
MESU is currently trading in a pullback structure after rejecting from the recent high around 7,820.
The first upside liquidity level I’m watching is 7,774. Price may bounce into that area before deciding whether to resume the bearish move or continue higher.
On the downside, the higher-time-frame fair value gap begins around 7,682. The lower-time-frame imbalances align with this green highlighted zone, creating a larger confluence area that may attract price during the current pullback.
A confirmed 1-hour close above 7,820 would invalidate the short-term bearish or neutral outlook and shift the tone back to bullish.
Key levels
7,774: First upside liquidity target
7,820: Bullish confirmation level
7,682: Higher-time-frame fair value gap and potential reaction area
Primary scenario
Price bounces toward 7,774, reacts from that area, and continues lower toward the fair value gap near 7,682.
Alternative scenario
Price breaks above 7,774 and eventually produces a confirmed hourly close above 7,820, shifting the structure back to bullish.
I will wait for confirmation at the key levels rather than entering in the middle.
Not financial advice. No confirmation, no trade.
 MESU2026