BTCUSD H1 MARKET | EXECUTIVE OVERVIEW
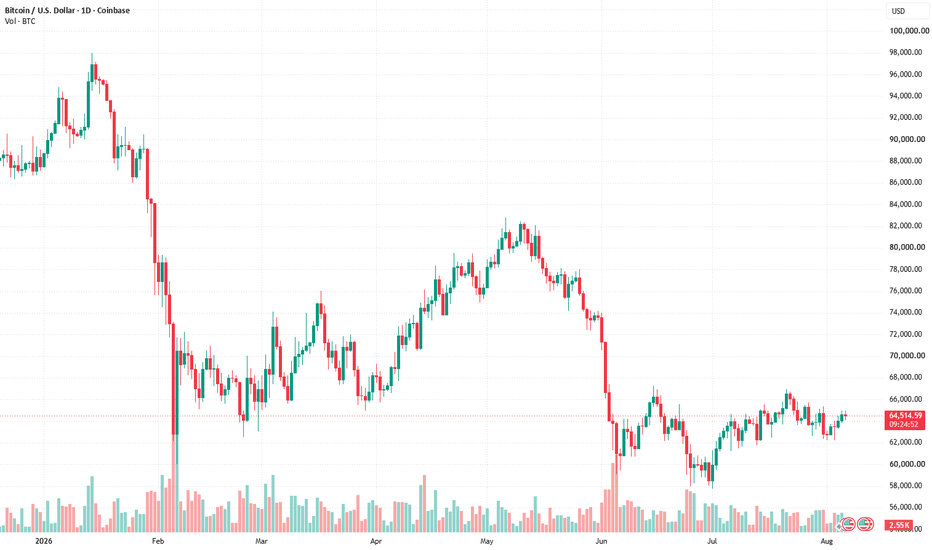
▪️ BTCUSD H1 MARKET SNAPSHOT | EXECUTIVE OVERVIEW
▪️ Bitcoin is currently positioned near 64,511, moving higher from the Aug 3 demand area and approaching several liquidity zones above. The nearest major liquidity pocket is only around ~$190 higher, while stronger London demand remains much lower. Price is compressed directly beneath resistance.
▪️ The main expectation is an initial move upward to collect liquidity, followed by rejection and a bearish rotation. Price may first reach the upper liquidity zones, fail to remain above them, and then fall back through 64,000 toward demand. The broader projected move continues toward the 63,580 area.
▪️ The main resistance region sits between 64,850 → 65,400. These two liquidity bands form the primary reversal zone where the upward sweep may lose momentum. Above this region, the next important level is the 66,000 Bearish FVG, rated 3/10 and formed during the London session.
▪️ The key defensive support is 63,580. This area is a 9/10 STRONG London Bullish OB and represents the first meaningful demand zone below current price. It is also the level where the projected bearish move initially ends. Stronger support remains beneath it.
▪️ If price breaks lower, the main downside path is 64,000 midpoint → 63,580 Bullish OB. This is where the expected decline meets the first major liquidity and demand cluster.
▪️ The larger liquidity attraction below extends from 63,580 → 62,610. This deeper move becomes relevant if 64,000 breaks and the 63,580 OB cannot hold. The upside liquidity path remains 64,850 → 65,400 liquidity → 66,000 FVG.
▪️ Bullish scenario: Price reclaims 65,400, holds above the liquidity zone, and breaks through the current ceiling. This would open the way toward the 66,000 Bearish FVG and possibly higher, while invalidating the expected bearish reversal.
▪️ Bearish scenario: Price sweeps the 64,850 / 65,400 liquidity zones, forms a lower-high retest, and rejects. The next move would then push back through 64,000, target 63,580, and potentially extend toward 62,950 / 62,610 demand.
▪️ KEY LEVELS
▪️ Current Price: ~64,511
RESISTANCE LEVELS
▪️ 66,000 | ★ 3/10 | Bearish FVG | London | ~$1,490 away
▪️ 65,400 | ◆ Heavy overhead liquidity, upper pool | ~$890 away
▪️ 64,850 | ◆ Heavy overhead liquidity, lower pool | ~$340 away
SUPPORT LEVELS
▪️ 63,580 | ★★★★ 9/10 STRONG | Bullish OB | London | ~$930 away
▪️ 62,950 | ★★★ 6/10 | Bullish FVG | London | ~$1,560 away
▪️ 62,610 | ★★★★★ 10/10 STRONG | Bullish OB | London | ~$1,900 away
▪️ ORDER FLOW AND ZONE STRUCTURE
▪️ Supply above price: 64,850 liquidity → 65,400 liquidity → 66,000 Bearish FVG (3/10). These stacked liquidity zones form the main ceiling. The expected upward sweep is likely to run into this area before a bearish reaction begins.
▪️ Demand below price: 63,580 Bullish OB (9/10 STRONG) → 62,950 Bullish FVG (6/10) → 62,610 Bullish OB (10/10 STRONG). This sequence forms the primary demand structure. The 63,580 OB is the first defense level, while the 62,610 OB is the strongest potential reversal zone on the chart.
🔍 EXPECTED SCENARIO
▪️ First move higher: Price advances from the current area toward 64,850 → 65,400, collecting liquidity and triggering resting orders above.
▪️ Rejection stage: Price fails to hold inside or above the liquidity region, forms a lower high, and moves back below 64,000.
▪️ Bearish continuation: The decline reaches the 63,580 Bullish OB and may continue toward the deeper 62,950 / 62,610 demand zones.
▪️ My view: Bitcoin remains compressed beneath several layers of liquidity while stronger demand is positioned below. The structure favors a liquidity sweep followed by a reversal. The first move higher may act as a trap, collecting liquidity around 64,850/65,400 before price rotates lower toward 63,580/62,610.
The stronger long opportunity would appear only after a deeper decline into demand followed by a confirmed hold. A clean reclaim and acceptance above 65,400 would change the structure and support a bullish move toward 66,000. The clearer opportunities remain near the outer zones, while the middle of the range is more likely to remain unstable.
🔒 These levels and scenarios are based on the zone model. This is not a signal and not a guaranteed outcome. It is a market scenario built around liquidity and price structure.
▪️ ProjectSyndicate Levels Desk provides weekly support, resistance, and liquidity zones for XAUUSD, GBPUSD, NVDA, NQ, ES & GC. Subscribe to follow future updates.