EUR/USD Weekly Outlook: FOMC Repricing Drives Price Into Daily R
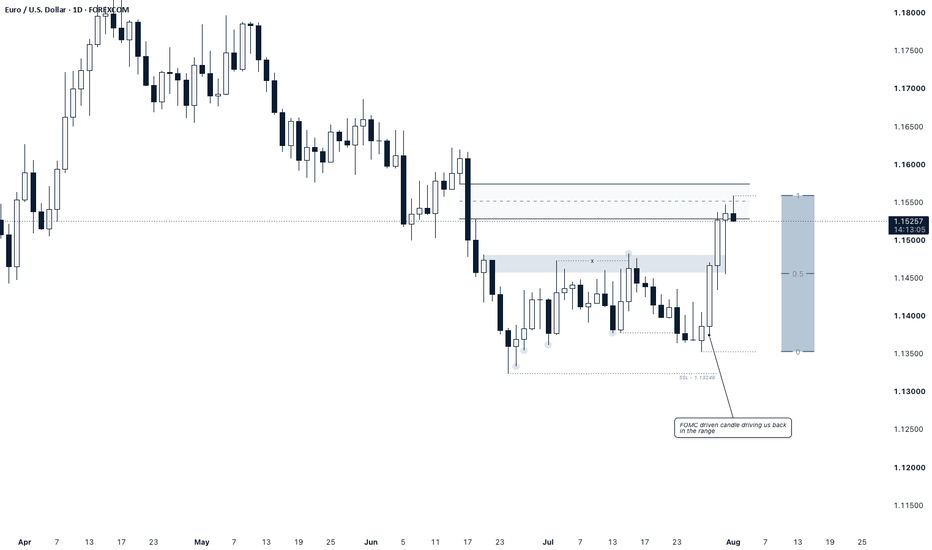
EUR/USD has completed a sharp repricing from the lower boundary of the daily range and is now entering the next important area of opposing interest.
Last week’s move was not simply a technical “liquidity grab.” The expansion followed a meaningful change in the macro environment after the Federal Reserve held rates at **3.50%–3.75%**. Although three FOMC members preferred a rate increase, the majority judged the existing stance sufficiently restrictive. The dollar weakened after the decision as participants reduced expectations for further near-term tightening. ()
This fundamental repricing produced the displacement visible on the chart.
The important question now is whether that displacement can maintain acceptance above the former consolidation, or whether EUR/USD has simply moved from one liquidity condition into another area of resistance.
---
### Fundamental context
The relative policy outlook has become more supportive of EUR/USD in the immediate term.
The Federal Reserve continues to describe inflation as elevated, but its decision to hold rates weakened the immediate case for another increase. Market commentary following the meeting suggested the Fed could remain on hold for the rest of the year unless inflation accelerates materially. ()
The European Central Bank also kept rates unchanged at its July meeting, leaving the deposit facility at **2.25%**. However, the ECB stressed that the full inflationary consequences of the recent energy shock have not yet passed through the economy. Higher input costs and persistent uncertainty limit the ECB’s ability to signal an early return to accommodative policy. ()
July euro-area inflation reportedly rose to **2.9%**, while the economy expanded by **0.4% during the second quarter**. That combination has strengthened expectations that the ECB may need to maintain, or potentially increase, its restrictive stance. ()
The current policy contrast is therefore becoming clearer:
**The Fed has paused after an extended tightening cycle, while the ECB continues to face material inflation risks from energy and input costs.**
That relative repricing has supported the euro and weakened the dollar.
Broader FX flows also moved against the dollar at the beginning of the week. EUR/USD reached approximately **1.1559**, its highest level in around six weeks, while falling oil prices and easing geopolitical concerns reduced some of the defensive demand previously supporting the US currency. ()
---
### Institutional liquidity context
Recent ECB stress testing also highlighted vulnerabilities in the foreign-currency liquidity held by euro-area banks.
The ECB found that severe geopolitical, energy, sanctions or cyber-related shocks could create foreign-currency funding pressure. Although most banks remained above minimum liquidity requirements, the exercise identified structural weaknesses in how some institutions estimate and manage FX liquidity risk. ()
This matters because the FX market is not driven by candlestick patterns in isolation.
Banks continuously manage:
* Client flow
* Currency inventories
* Funding requirements
* Hedging exposure
* Counterparty risk
When macroeconomic information changes, dealers adjust quotes and inventory exposure. That process alters the available execution capacity across the interbank market and can produce the type of rapid displacement visible after the FOMC decision.
Price did not rise because an algorithm decided to hunt the highs.
It rose because the balance between available dollar supply, euro demand and dealer positioning changed quickly enough that higher prices were required to facilitate execution.
---
## EXODUS interpretation
Before the FOMC decision, EUR/USD was trading near the lower boundary of its daily range.
The sell-side reference at **1.13246** remained visible, but price did not trade deeply enough through that level to produce sustained bearish continuation. Instead, selling was absorbed above the low and the market returned into the range.
That reaction was followed by a significant bullish candle.
Within EXODUS, this sequence is read through consequence:
**Observation:** Price failed to continue towards the lower sell-side objective.
**Structure:** EUR/USD remained inside the broader daily range.
**Delivery:** The FOMC repricing produced bullish displacement through the internal consolidation.
**Current location:** Price has now reached the upper half of the range and is entering a daily area of opposing liquidity.
The move is therefore bullish in delivery, but it is no longer occurring from an attractive discount.
Price is now trading directly beneath the daily pocket between approximately:
**1.1530–1.1570**
This area contains prior bearish delivery and is where buyers must prove that the recent expansion represents a genuine change in control.
---
## Weekly bias
My weekly bias is **conditionally bullish**, but price is now entering resistance.
The immediate draw is the upper boundary of the daily pocket near:
**1.1550–1.1570**
The bullish thesis remains valid while price maintains acceptance above the former consolidation and continues defending approximately **1.1460–1.1480**.
However, I am not interested in buying aggressively into the current daily resistance.
The highest-quality opportunity has already occurred during the expansion away from the lower range. From here, execution requires patience.
---
## Bullish scenario
For continuation, I want to see price:
1. Trade through the internal highs around **1.1550**.
2. Consume the remaining offers inside the daily pocket.
3. Close and maintain acceptance above approximately **1.1570**.
4. Defend the origin of the breakout on a subsequent retracement.
A confirmed break above the pocket would indicate that the available sell-side interest was insufficient to reverse delivery.
That could open the path towards the next external references above **1.1600**, followed by the prior daily structure around **1.1650**.
For day trading, the preferred opportunity would be:
**Expansion through resistance → controlled retracement → bullish array holds → continuation.**
I would not treat a temporary wick through 1.1550 as confirmation. Price must demonstrate acceptance after the liquidity is accessed.
---
## Bearish scenario
The current area can also produce a rotation lower.
If EUR/USD enters **1.1530–1.1570**, introduces buyers into the market but fails to maintain higher prices, the move may represent the completion of the current bullish objective rather than the beginning of another expansion.
Signs of failure would include:
* Repeated upper rejection wicks
* No daily acceptance above the pocket
* Lower-timeframe bearish displacement
* A return beneath **1.1500**
* Failure to reclaim the origin of the rejection
A confirmed rejection could rotate price back towards:
**1.1470–1.1450**
This is the first area in which I would assess whether the previous resistance has transitioned into support.
If that area also fails, the range equilibrium near **1.1410** becomes vulnerable.
---
## Day-trading framework
The weekly direction may be bullish, but intraday execution must respect location.
At the beginning of the week, I will be watching two conditions.
### Acceptance above the pocket
If London or New York removes the upper liquidity and maintains delivery above **1.1570**, I will look for retracements into newly formed bullish arrays.
### Failure inside the pocket
If price trades above recent highs but cannot sustain the expansion, I will look for a lower-timeframe bearish sequence back towards **1.1500** and potentially **1.1470**.
The liquidity event alone is not the trade.
The reaction after the event reveals whether orders are being absorbed or whether price is being accepted into a new area.
---
## Key levels
**Immediate resistance:** 1.1530–1.1570
**Bullish confirmation:** Acceptance above 1.1570
**First bullish support:** 1.1460–1.1480
**Range equilibrium:** Approximately 1.1410
**Major sell-side reference:** 1.13246
---
## Final perspective
The FOMC candle has changed the short-term delivery, but price is now approaching the area where that bullish thesis must be tested.
The move into resistance is not automatically bearish.
The presence of resistance is not automatically a short.
What matters is whether buyers can continue consuming the available offers and maintain acceptance at higher prices.
**Above 1.1570, bullish delivery gains confirmation.**
**Below 1.1460, the expansion begins to lose structural strength.**
**Inside the pocket, observation comes before execution.**
Liquidity creates the condition.
Delivery reveals the intention.
Structure defines the opportunity.
Execution comes last.