BTC/USD — Bearish structure forming (H1)
Bitcoin / USD BINANCE:BTCUSD
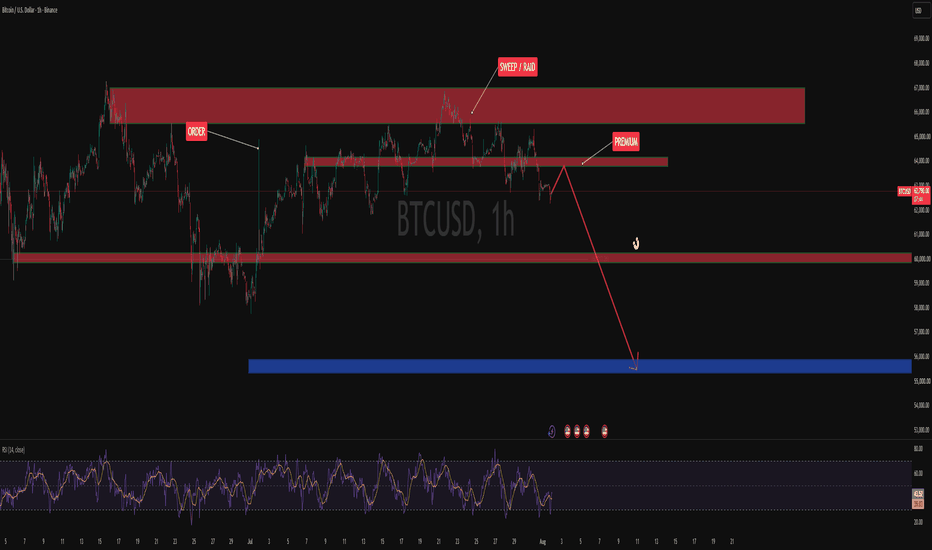
Bitcoin is showing clear signs of weakness. After failing to confirm its bullish breakout, price is rejecting the resistance zone and forming a lower highs / lower lows structure, typical of a developing bearish reversal
📊 Market Structure
On H1, price formed a local high around 65,000 $, followed by a sharp rejection toward 63,000 $. This loss of momentum, combined with a close below the 50 moving average, confirms the current selling pressure. The 63,000 $ zone now acts as a key support to watch
📉 Key Technical Levels
- Major resistance: 65,000 $ (rejection zone, dominant supply)
- Immediate support: 63,000 $
- Next support on breakdown: 60,000 $ (liquidity zone)
- Bearish scenario invalidation: H4 close above 66,000 $
🧭 Indicators
- RSI (H1): trending below 45, no bullish divergence — confirms selling pressure
- Volume: increasing on bearish candles, showing active seller participation
- Moving averages: bearish crossover MA20/MA50 on H1
🎯 Preferred Scenario
As long as price stays below 65,000 $, I favor a bearish continuation toward 60,000 $, with a possible retest before the drop continue
⚠️ Invalidation
A confirmed H4 close above 66,000 $ would invalidate this scenario and open the door to a bullish move toward 67,000 $
Technical analysis for educational purposes only, not financial advice. Always manage your risk