

BOS vs CHOCH
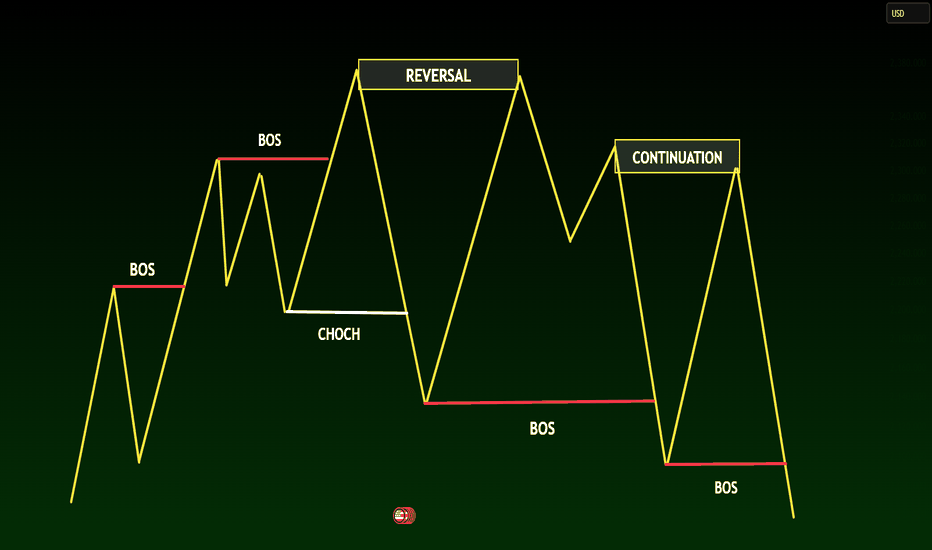
Why Most Traders Misread Market Structure
🔹There is a common mistake in Smart Money Concepts:
Traders see a structure break and immediately call it a reversal.
But the market does not reverse simply because one high or low has been broken.
A structure break is only a piece of information.
To understand what the market is actually doing, we need to look at the sequence:
Liquidity → Displacement → Structure Break → Retracement → Confirmation
This is where the difference between BOS, CHOCH, Reversal and Continuation becomes important.
🔹1. Start With Structure — Not With Entries
Before looking for a trade, identify the current structure.
A bullish market typically develops:
HH → HL → HH → HL
A bearish market typically develops:
LL → LH → LL → LH
As long as these structural relationships remain intact, there is no strong reason to assume that the trend has changed.
This leads to the first rule:
Never call a reversal before the existing structure has actually been challenged.
🔹2. BOS — The Market Is Continuing
BOS = Break of Structure
A BOS occurs when price breaks an important structural level in the direction of the prevailing trend.
In a bullish structure:
HH → HL → HH
If price breaks the previous HH and continues higher, we have a bullish BOS.
In a bearish structure:
LL → LH → LL
If price breaks the previous LL, we have a bearish BOS.
So the simplest way to think about BOS is:
BOS tells us that the current structural direction is still being respected.
But there is an important detail:
Not every high or low is structural.
A minor internal swing should not automatically be treated as a major BOS.
The higher the timeframe and the more significant the swing, the more meaningful the break becomes.
🔹3. CHOCH — The First Warning
Now imagine a bullish market:
HH → HL → HH → HL
Suddenly, price breaks below an important HL.
This is where we can identify a:
CHOCH — Change of Character
The market has broken a level that was previously protecting the bullish structure.
This doesn't mean:
"The market must go down."
It means:
"The previous bullish behavior is no longer behaving as expected."
That distinction is extremely important.
CHOCH is a warning.
It is not a guaranteed reversal signal.
🔹4. The Mistake That Traps Traders
Consider this scenario:
Price is bullish.
It takes liquidity above a previous high.
Then it sharply moves lower and breaks an important low.
A trader sees:
CHOCH → SELL
But there is a problem.
What if the market simply performs a deeper retracement?
What if price reclaims the broken structure?
What if the move was only a liquidity sweep?
The trader entered because of a label, not because of a complete market narrative.
And this is one of the biggest mistakes in structure-based trading.
🔹5. The Market Needs to Prove the Reversal
For a stronger bearish reversal, I want to see the market transition from:
HH → HL
toward:
LH → LL
The sequence becomes:
Bullish Structure
↓
Liquidity Event
↓
Bearish Displacement
↓
CHOCH
↓
Retracement
↓
Lower High
↓
Bearish BOS
↓
Continuation
Now the market is not simply breaking one level.
It is building an entirely different structure.
That is much more meaningful.
🔹6. Liquidity Is the Missing Piece
Structure alone doesn't tell the entire story.
Before a major move, price often interacts with liquidity.
Examples include:
Equal Highs
Equal Lows
Previous Day High
Previous Day Low
Previous Week High
Previous Week Low
Major Swing Highs
Major Swing Lows
Why does this matter?
Because a market can temporarily move beyond a structural level simply to access liquidity.
For example:
Equal Highs
→ Price trades above them
→ Stops are triggered
→ Price sharply rejects
→ Bearish displacement begins
→ Structure breaks
Now the structure break has context.
🔹7. Liquidity Sweep ≠ BOS
This distinction is critical.
A liquidity sweep can look like a breakout.
But the market may only be taking resting orders before reversing.
Think about it this way:
Sweep
Take the level → Reject → Reverse
BOS
Break the level → Accept beyond it → Continue
Of course, the difference cannot always be determined from one candle.
We need to observe what price does after the break.
🔹
8. Reversal vs Continuation
This is where the framework becomes powerful.
REVERSAL
The market changes its structural behavior.
Example:
HH → HL → HH
↓
CHOCH
↓
LH → LL
The market is transitioning from bullish to bearish.
CONTINUATION
The market temporarily retraces but maintains its original structure.
Example:
LH → LL → LH
↓
Retracement
↓
LL
The market continues lower.
So before calling a reversal, ask:
Did the market actually create a new structure, or did it simply retrace?
🔹9. Displacement — The Confirmation Most Traders Ignore
One of the strongest clues after a liquidity event is displacement.
Displacement means a strong, decisive price movement showing clear imbalance and directional intent.
For example:
Liquidity Sweep
↓
Strong Bearish Displacement
↓
Break of Structure
This is far more informative than a small candle simply crossing a level.
When price moves aggressively away from an area, it tells us that there is a significant change in order flow and participation.
🔹10. The Complete Model
Instead of trading isolated concepts, connect them.
Step 1 — Identify the HTF Structure
What is the higher-timeframe direction?
Step 2 — Mark Important Liquidity
Where are the obvious highs and lows?
Step 3 — Wait for Price to Reach Liquidity
Don't chase price in the middle of nowhere.
Step 4 — Observe the Reaction
Does price reject?
Does it consolidate?
Does it displace?
Step 5 — Identify the Structure Break
Is this BOS or CHOCH?
Step 6 — Wait for the Retracement
Don't chase the displacement candle.
Step 7 — Look for Confirmation
Does price create a new structural point?
Step 8 — Define Invalidation
At what point is your idea objectively wrong?
Step 9 — Target Liquidity
Where is the next logical destination for price?
🔹11. A Simple Example
Imagine EURUSD is bullish on the higher timeframe.
Price has created:
HH → HL → HH
Then price moves above a previous high and takes liquidity.
Instead of continuing higher, it aggressively rejects.
Then:
Bearish Displacement
occurs.
Price breaks the previous HL.
That's our:
CHOCH
But we don't immediately sell.
We wait.
Price retraces back into the area of interest.
Then creates a:
Lower High
Finally, price breaks the previous low.
Now we have:
Bearish BOS
The narrative is much stronger:
Liquidity → Displacement → CHOCH → Retracement → LH → BOS
The target can then be projected toward the next meaningful sell-side liquidity.
🔹12. The Real Secret
The goal is not to predict every reversal.
The goal is to understand when the market has provided enough evidence to change your bias.
There is a huge difference between:
"I think the market will reverse."
and:
"The market has taken liquidity, displaced aggressively, broken an important structural level, failed to reclaim it, created a lower high, and then continued lower."
The second statement is not a prediction.
It is a structured interpretation of price action.
🧠 The Framework
Remember this sequence:
STRUCTURE
What is the market doing?
↓
LIQUIDITY
Where are traders trapped or stops likely resting?
↓
DISPLACEMENT
Where does aggressive order flow appear?
↓
CHOCH
Has the previous structure been challenged?
↓
RETRACEMENT
Does price return to an area of interest?
↓
CONFIRMATION
Does the new structure hold?
↓
BOS
Is the new direction continuing?
↓
TARGET
Where is the next meaningful liquidity?
⚠️ Final Thought
Don't trade BOS.
Don't trade CHOCH.
Don't trade liquidity.
Trade the relationship between them.
A single market-structure event can be misleading.
A sequence of events creates a narrative.
And the better you understand that narrative, the less you need to predict the market.
The market doesn't need to tell you where it's going.
It only needs to show you what it's doing.
Save this framework.
The next time you see a BOS or CHOCH on your chart, don't immediately look for an entry.
Ask yourself:
What liquidity was taken?
Was there displacement?
Which structural level actually broke?
Did price create a new structure?
Where is the next liquidity target?
That is how you move from drawing labels on a chart to actually reading market structure.


