

KSE-100 | THE CHART ALCHEMIST | 1H | 09 AUGUST 2026
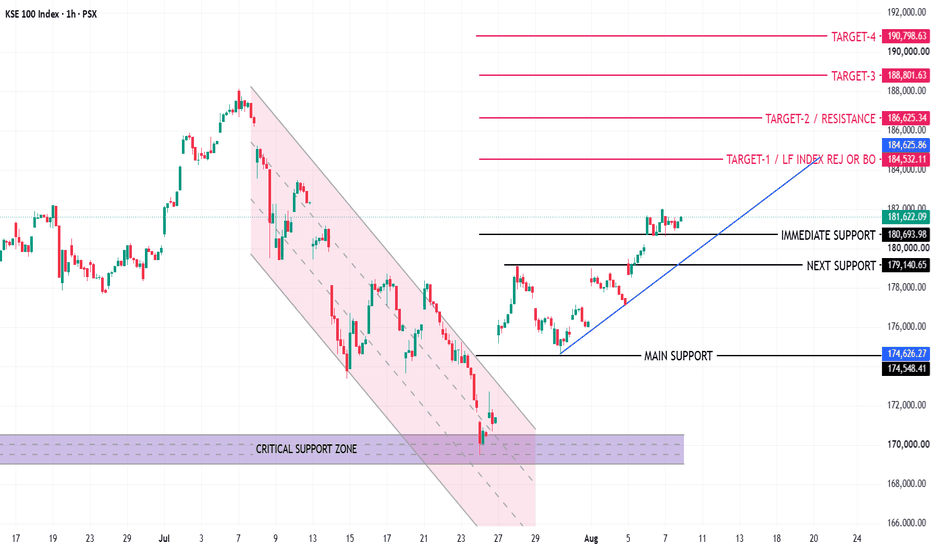
KSE-100 — TECHNICAL ANALYSIS BY THE CHART ALCHEMIST | 1H | 09 AUGUST 2026
📊 MARKET STRUCTURE
Following a high of 188,215, the KSE-100 entered a pronounced bearish leg, characterized by multiple Selling Climaxes, eventually driving the index down to a low of 169,500.
From this level, the market witnessed a sharp reversal, marking a significant shift in short-term price action and initiating a strong bullish recovery.
🔄 BULLISH REVERSAL & STRUCTURAL SHIFT
The reversal from 169,500 triggered a powerful upward move, with the index subsequently reclaiming and retesting the Axial Line at 174,550.
The 174,550 Axial Line has now developed into a major structural support. Its ability to hold is important for maintaining the integrity of the current bullish structure.
As long as price continues to respect this structural level, the broader recovery remains technically constructive.
📈 CURRENT MARKET TREND
The KSE-100 is currently moving through a channel phase within the broader bullish structure.
Price action remains constructive, with the index attempting to advance toward the higher resistance and target zones.
The immediate focus remains on how price behaves around the upcoming target levels. Consolidation or temporary rejection at these levels should not automatically be interpreted as a trend reversal unless accompanied by a breakdown of the underlying support structure.
🛡️ KEY SUPPORT LEVELS
Immediate Support: 180,690
Secondary Support: 179,140
Main Support — Axial Line: 174,550
Critical Support Zone: 169,000 – 170,530
The 174,550 Axial Line remains the key structural reference. A sustained breakdown below the major support structure would weaken the current bullish thesis and require reassessment of the market structure.
🎯 UPSIDE TARGETS
Target 1: 184,530
Target 2: 186,620
Target 3: 188,800
Target 4: 190,800
These levels represent successive areas where the market may encounter supply, profit-taking, rejection, or consolidation.
A sustained breakout and acceptance above each resistance area would strengthen the probability of continuation toward the subsequent target.
⚠️ MARKET OUTLOOK
The 1H structure remains bullish as long as the major support levels continue to hold.
Short-term rejection or consolidation around the projected target zones is possible and should be viewed within the context of the prevailing structure rather than in isolation.
A sustained move above the respective resistance/target levels would indicate continued bullish momentum and potentially open the path toward the next upside objective.
Conversely, deterioration in price structure followed by a breakdown of the key support levels would invalidate or significantly weaken the current bullish scenario.
CURRENT BIAS: BULLISH — STRUCTURE INTACT
DISCLAIMER: This analysis is shared strictly for informational and educational purposes. It is not a solicitation, recommendation, or guarantee of future market performance. No Claim. No Blame.
