XẤU/usd)Breiah trend analysis Read The caption
SMC Trading Point Update
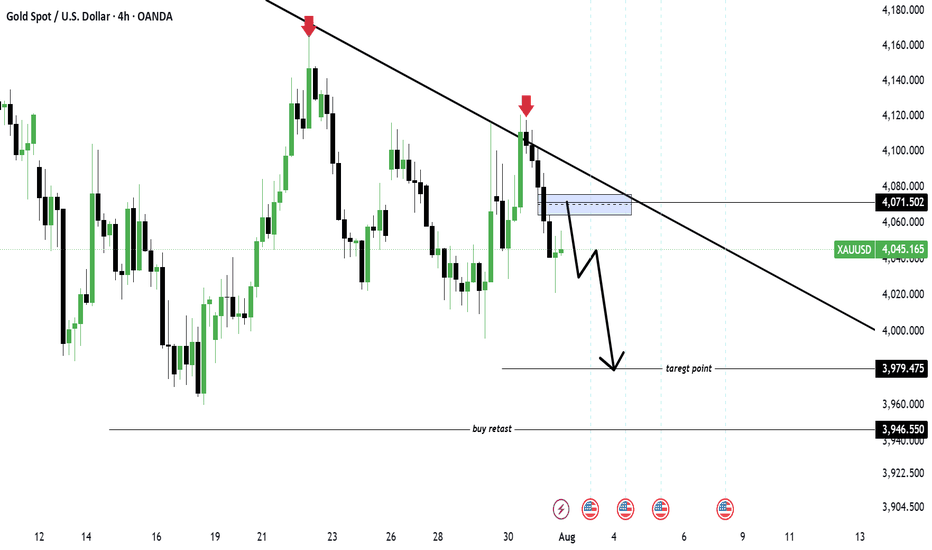
Technical analysis of 4H XAU/USD (Gold) chart. Based on the visible price action alone:
Market Structure
The overall trend is bearish.
Price is making lower highs, and the descending trendline is still intact.
The recent rejection from around 4105–4110 confirms sellers are defending that area.
Key Resistance
4065–4075 (blue supply/FVG zone).
Descending trendline around 4070–4085.
If price enters this zone and prints bearish rejection (engulfing candle, pin bar, etc.), it favors another move down.
Key Support
4028–4035 (current support).
3979 is the first major downside target.
3946 is the next strong support if 3979 breaks.
Trade Idea.Mr SMC trading point
Bearish scenario (higher probability):
Wait for a retracement into 4065–4075.
Look for bearish confirmation before selling.
Stop-loss: Above 4085–4095 (or above the recent swing high, depending on your strategy).
Take Profit 1: 3979
Take Profit 2: 3946
Bullish Invalidation
The bearish setup becomes weaker if:
A 4H candle closes above 4080–4090 and breaks the descending trendline with strong momentum.
In that case, price could retest 4105–4120.
Probability
Based only on this chart:
Bearish continuation: ~70–75%
Bullish breakout: ~25–30%
Please boost this analysis