
BTC $64,893.00 ▼ 0.09% ETH $1,916.37 ▼ 0.17% USDT $0.9993 ▼ 0.01% BNB $602.99 ▲ 1.32% XRP $1.04 ▼ 0.24% SOL $76.43 ▲ 1.37% DOGE $0.0701 ▼ 0.37% SHIB $0.00000462 ▼ 0.58% PEPE $0.00000287 ▲ 0.31% BTC $64,893.00 ▼ 0.09% ETH $1,916.37 ▼ 0.17% USDT $0.9993 ▼ 0.01% BNB $602.99 ▲ 1.32% XRP $1.04 ▼ 0.24% SOL $76.43 ▲ 1.37% DOGE $0.0701 ▼ 0.37% SHIB $0.00000462 ▼ 0.58% PEPE $0.00000287 ▲ 0.31%
Bitcoin Piyasa

Symmetry <Danger Zones>

Symmetry <Danger Zones>

Bitcoin / TetherUS BINANCE:BTCUSDT
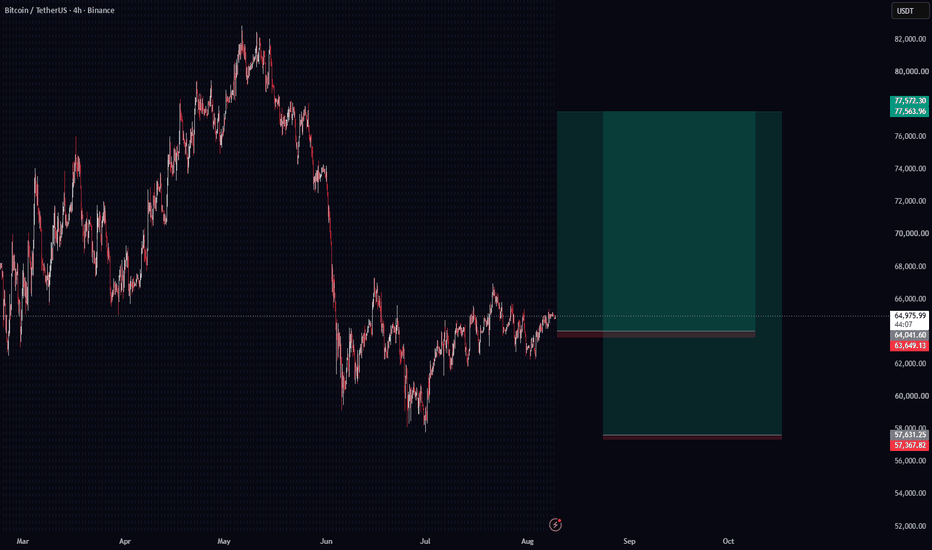
BTC follows Symmetry
just wait for entry signal

Price symmetry refers to comparing the size of past and current price movements to identify balance or repeating patterns.
It assumes that the market tends to make similar upward and downward moves in terms of price distance (such as wave length or correction size).
Analysts measure previous price swings and compare them with the current move to identify potential reversal or continuation points.


İlgili Haberler

Yorumlar (0)

Yorum yapmak için giriş yapın.

Henüz yorum yapılmamış. İlk yorumu siz yapın.

İçerik Alanı728x90