Market DNA Copper Cycle 4 Phase 4 of 4
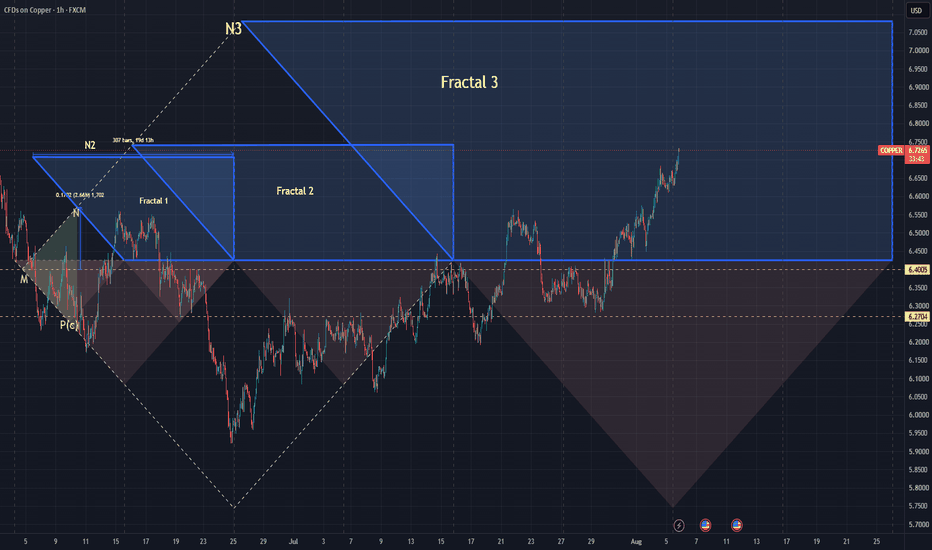
Market DNA Copper Cycle 4 Phase 4 of 4
Phase: 1
Date & Time: 2026-06-05 12:50 EST
Primary Entry M: 6.4005 $
Secondary Entry P(c): 6.2704$
Mean Entry: (6.2704+6.4005)/2=6.3354$
Trapezoid Time Duration: 20 Days
3th Triangle domain (%): 2 * 2.66% = 5.32%
Risk coefficient (R): 2
Risk domain (%) (D): (3th Triangle domain) *(Risk coefficient) = 5.32%*2 = 10.64 %
Hypothetical Capital: 100,000$
Contract Size: 10000 Unit
Expected Max Drawdown (%): 5%
Expected Max Drawdown $ (EMDD): 100,000 * 5% = 5,000
Expected Low Price: (1 – 10.64%) * 6.3354$ = 5.6613$
Size: 5,000 / (6.3354 – 5.6613) ~= 7417.29Unit
Position Size: Size/Contract Size = 7417.29 /10000 = 7.41
Each Trade Size = 7.41 /2 = 0.37
Targets:
T1 (Mirror / Lower Trapezoid): 6.424$
T2 (Apex N): 6.57 $
T3 (Trapezoid Top): 6.708$
Expected Profit by first entry and Exit at T3 for Scenario No 1:
(T3 - Entry M) * Contract Size * Each Trade Size = (6.708 -6.4005) *10000*0.37= 1,138$
Expected Total Profit for Scenario No 1: 1,138$
Expected Return % for Scenario No 1: 100*(1,138/100,000) = 1.13%
Expected Annual Return% for Scenario No 1: (1.13 %*365/20) =20.62%
Expected Profit by 2th entry and Exit at T2 for Scenario No 2:
(T3 - Entry M) * Contract Size * Each Trade Size = (6.708 -6.4005) *10000*0.37= 1,138$
(T2 - Entry P(c)) * Contract Size * Each Trade Size = (6.57 -6.2704) *10000*0.37= 1,108$
Expected Total Profit for Scenario No 2: 1,138+1,108=2,246$
Expected Return% for Scenario No 2: 100*(2,246/100,000) =2.25%
Expected Annual Return% for Scenario No 2: 2.25%*365/20=41.05%
Notes: P(c) may or may not be reached; both M and P(c) are Phase 1 only.
"Both trade sizes are calculated using the hypothetical capital, the investor’s maximum allowed drawdown, the 3rd Triangle Domain percentage, the Risk Coefficient, and the Contract Size."
TotalSize=(EMDD=5000)/(2*D*R*MeanPrice*ContractSize)
Will the next phase be Phase 2 or 3? We are navigating the market to see what happens next.

Phase: 2
Date & Time: 2026-06-12 15:00 EST
The Price Touched the Trapezoid Lower Boundary at 6.4565$.
Up to this point, the initial position was opened at 6.4005$ and 6.2704$ at M and P(c) Price Level. Will the next phase be Phase 3? We are navigating the market to see what happens next.
Phase 3:
Current Date & Time: 2026-08-04 00:55 EST
Price touched the N Price Level at 6.57 $ out of time window in fractal 1. But before this event, the Price could touch tow times to trapezoid lower boundary from below of P(c) and Safety buffer charged twice. At this stage half of opened position released and appends to Safety Buffer and it adjusted to 1,458$ and the SRB is adjusted to 5.4626$.
Up to this point, half of the position that was already opened at 6.4005 on M, remains open, the Phase3 is completed by reaching the Price at 6.57$. Will the next phase be Phase 4? We are navigating the market to see what happens next.
Phase: 4
Current Date & Time: 2026-08-05 12:40 EST
The Price reached to the Trapezoid Upper Boundary T3 at 6.708$.
The expected total profit for Scenario No. 2 in Phase 1 was 2,246$ and now 2,003$ has been realized completely by releasing 1,458$ from SaftiBuffer and 545$ profit from Cycle completion on phase4.
Realized Return (%): 100*(2,003/100,000) = 2.00%
Expected Return (%): 2.25%
The lowest price along this path was 5.9217$, which led to the storage of the maximum field for the continuation of the path. Furthermore, the maximum capital drawdown is calculated as follows:
(6.9217$ - 6.3354$) *10000*0.37 = -2,169$
Max Drawdown (%): 100*(-2,169/100,000) = -2.17%
Trapezoid Time Duration: 20 Days
Realized Time Duration: 61 Days