BTCUSD Daily Outlook: Broadening Wedge and "Macro Bottom" Scena
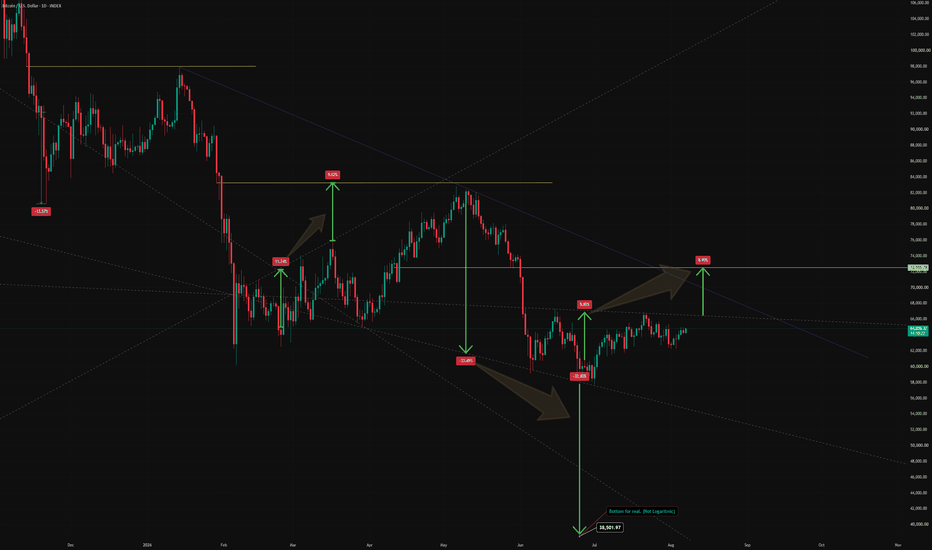
The current daily structure in the chart referenced as indicates that the market cycle is at a critical decision phase. Price action is progressing within a descending channel/broadening wedge formation with expanding peaks and troughs, generating notable signals when combined with momentum indicators.
📌 Technical Structure and Price ActionAs clearly seen on the daily (1D) chart, the price is facing consistent rejection from the upper trendline. The drawn yellow horizontal lines confirm that previous local tops are acting as strong resistance zones.Impulse and Corrective Waves: The upward (+11.24%, +5.62%, +8.99%) and downward (-12.57%, -23.45%, etc.) swings marked on the chart show that volatility is trapped within a specific structure, searching for a clear direction.Major Target: The price's struggle to break above the upper trendline and the projection indicated by the broad downward gray arrow keep the possibility of a sharp pullback toward the lower trendline on the table. In this scenario, the marked ~$38,501 level ("Bottom for real") should be closely monitored as a potential capitulation or macro bottom zone.
📊 Key LevelsLevel TypeStatus / DescriptionDynamic ResistanceThe major descending trendline, indicated by dashed purple lines, suppressing the price.Horizontal ResistancesPrevious local peaks marked with yellow lines. A trend reversal is not confirmed without a breakout.Major SupportThe lower boundary of the descending structure and the $38,500 major liquidity zone indicated by the projection.
📉 Oscillator and Momentum (RSI)The divergences marked in the oscillator structure on the bottom panel clarify the internal dynamics of the price action.Divergences: The drawn "Bull 1" and "Bear 1" divergences have successfully captured momentum weakness at the market's trend reversal points.In the current setup, despite the price's horizontal or slight upward momentum, the failure to gain strength on the oscillator side technically supports potential selling pressure (rejection probability) from the descending channel resistance.
Strategy: In the current outlook, long positions carry high risk until a descending trend breakout occurs with strong volume and daily closes are achieved above the yellow resistance lines. A more optimal strategy might be to monitor the market and look for macro reversal signals in the event of a potential wick down to the lower boundary (the $38.5k zone).