BTC Rejects 63.1K - Pre-NFP Squeeze - Aug 02 PM
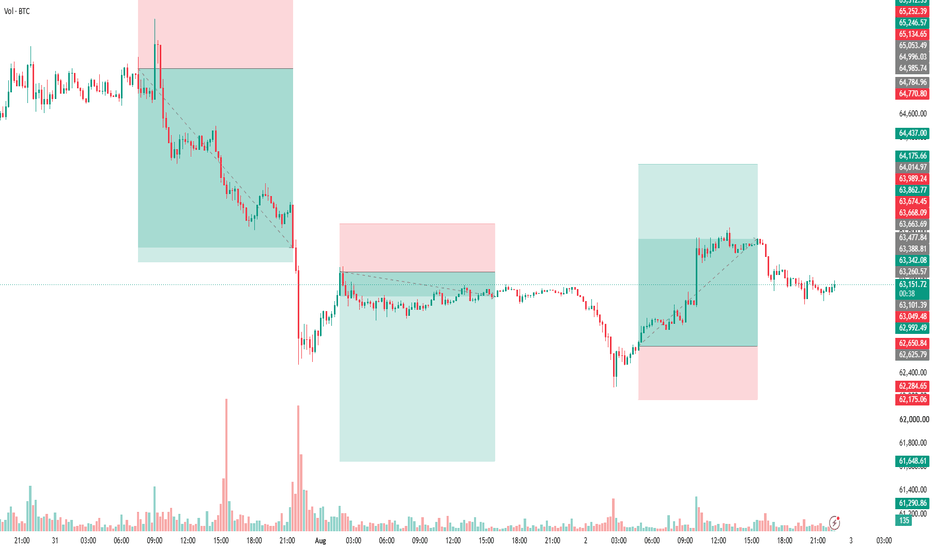
Current Price & Time:
BTC is trading at 63134 USDT as of 2026-08-02 14:43 UTC.
Multi-Timeframe Structure:
The daily structure remains bearish, with price holding below the daily EMA55. The 4H timeframe shows a mixed picture: price is above the 4H EMA55 but the broader trend is still capped by the 30-period MA at 63693. The 1H timeframe is the critical battleground. Price sits just 0.23% below the 1H EMA55 at 63278.55, and the last eight hourly bars show only one close above that line with a single crossing. This fails the trending threshold, so we are in a range-bound regime. The data suggests the market is coiling into the non-farm payroll release, with convexity compressing on both sides.
Chart Signals:
The 15M MACD histogram is positive at 4.24, with DIF crossing above DEA, but RSI at 47 shows no momentum conviction. The 1H MACD histogram is negative at -11.02, with DIF and DEA both positive but rolling over. This is a momentum divergence within a tight range. The 4H MACD histogram is positive at 24.78, but RSI at 39.43 indicates the larger timeframe still favors downside pressure. The last few hourly candles show long upper wicks near 63250-63300, confirming supply overhead. There is no clean bottoming pattern yet on the 1H, so longs require patience.
Key Liquidity Levels (Demand/Supply):
Demand (Support): 62950, 62500
Supply (Resistance): 63300, 63650
Chart Markup Guide for this setup:
Draw a horizontal dashed line at 63278.55 on the 1H chart — this is your bull/bear pivot. Mark the Demand zone between 62950 and 63100 with a green rectangle, as this is where the last two hourly closes found buyers. Mark the Supply zone between 63300 and 63450 with a red rectangle, as this has rejected price twice in the last six hours. Watch for a 15m close above 63300 as the trigger for the long scenario. A 15m close below 62950 would confirm the bearish breakout.
Scenario Analysis (If-Then):
If BTC holds above 62950 and prints two consecutive hourly closes above the 1H EMA55 at 63278.55, then the upside target is 63300, then 63650. A break above 63650 would shift the 4H structure bullish and open a path toward 64100. If BTC breaks below 62950 with a 15m close, then the downside target is 62500, then 62000. A break below 62000 would trigger a liquidity cascade, as stop clusters below that level are thin and the daily MACD histogram is already deeply negative.
Trading Plan:
Direction: Bearish bias above 62950, bullish only above 63300.
Entry: Long on a 15m close above 63300 with RSI on the 1H above 55. Short on a 15m close below 62950 with RSI on the 1H below 45.
Stop-Loss: For longs, place at 62980. For shorts, place at 63320.
Target-1: For longs, 63650. For shorts, 62500.
Target-2: For longs, 64100. For shorts, 62000.
Risk-Reward Ratio: Long setup offers approximately 1:2.3. Short setup offers approximately 1:2.1.
Invalidation Level:
The long setup is invalidated if price closes below 62950 on the 1H, as that would confirm a bearish regime with price below the EMA55 and momentum failure. The short setup is invalidated if price closes above 63300 on the 1H, as that would flip the range-bound assessment into a bullish breakout. Any news-driven spike that produces a 15m close beyond 63650 or 62500 would also invalidate the current positioning squeeze, and the plan should be abandoned.
Disclaimer:
This analysis is for informational and educational purposes only. It does not constitute financial advice. Past performance is not indicative of future results. All trading decisions carry risk and are your sole responsibility.
📊 QilanX Backtest Reference
🕒 Last Backtest: 08-02 07:00:01
Total Signals: 3352 Backtested: 3348 Accuracy: 82% (2747/3348)