BTC Breaks Above Descending Trendline – Is 65,7K the Next Aim?
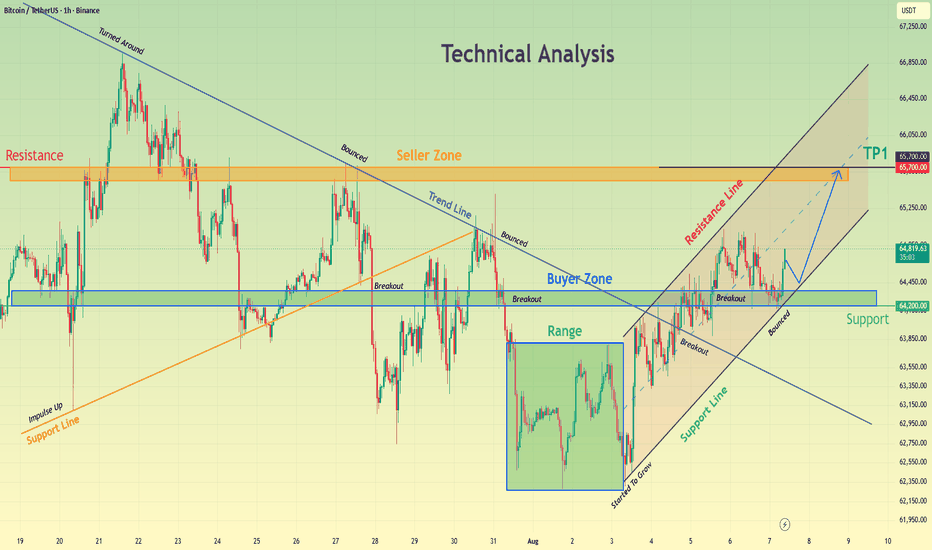
Hello traders! Here’s my technical outlook based on the current BTCUSDT (1H) chart structure. BTCUSDT previously broke above the long-term descending trendline before entering a recovery phase. After consolidating inside a range, price formed a rising channel and continues to respect its ascending support line, showing that buyers remain in control. Currently, BTCUSDT is trading above the 64,200 Buyer Zone while remaining below the 65,700 Seller Zone. The latest rebound from support suggests bullish momentum is building as price continues to hold above the previous breakout level. As long as BTCUSDT stays above the 64,200 Buyer Zone and respects the channel support, the bullish scenario remains valid. A continuation higher could push price toward the 65,700 Seller Zone (TP1). However, a break below 64,200 would weaken the bullish outlook and increase the risk of a deeper pullback. Please share this idea with your friends and click "Boost" 🚀