
SoFi
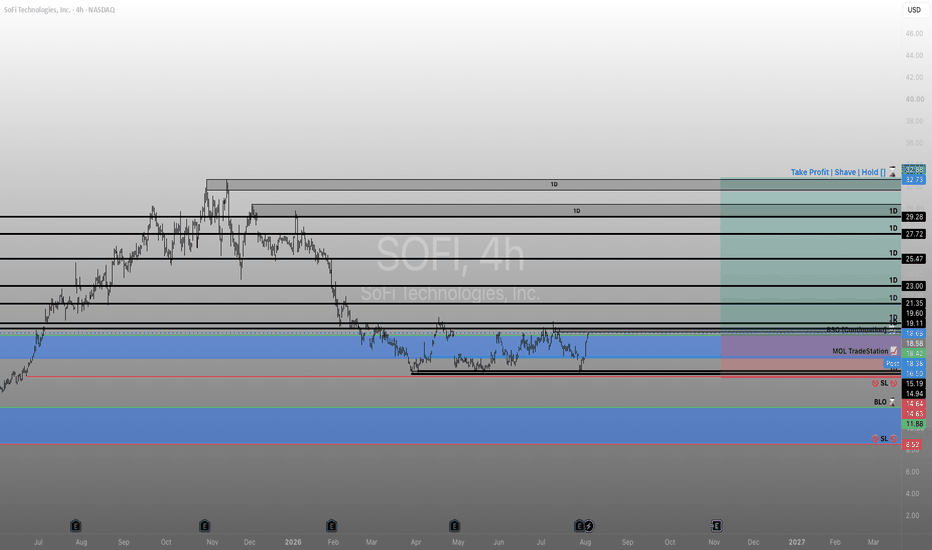
Action Items
• Move stop loss to maintain a 3:1 risk-to-reward ratio
• Mark all relevant daily levels on the chart in black, labeled 1D
• Re-enter at 11.88 if stopped out around the 16.50 area
• Consider color-coding different types of swing levels to differentiate nearest swings from older structural walls
• Reevaluate chart levels once price reaches the upper target zone
Trade Setup & Rationale
- Holding an existing market order long via TradeStation; also entered an additional BSO (buy stop order) on the same asset
- Price is back above a key daily level, with a target of 32.73
- Target was last reached in November of the prior year, making it a credible but not unreasonable upside goal
- Thesis is based on a higher high / higher low structure: previous high was broken, a higher low has now formed, and price is reclaiming a key level
- Notes a bullish momentum alert at the current level, expecting a trend continuation once the prior high is cleared
Stop Loss & Risk Management
- Original stop placement did not meet the 3:1 risk-to-reward requirement per trading strategy, so adjustment is needed
- Considering a stop around the 16.50 area, with a planned re-entry at 11.88 if stopped out
- A buy limit order is also placed at a prior push-off level, anticipating bullish strength on any pullback to that zone
- Wants to avoid tying up capital in a position that isn't gaining volume
Chart Markup & Daily Levels
- Marking daily (1D) levels in black text directly on the chart to serve as a roadmap for expected price reactions across smaller timeframes
- Several daily levels identified between current price and the target; expects turbulence at each
- One level near the target is flagged as a significant resistance zone and labeled accordingly
- Observing gap-ups amid red candles, which may signal swing potential on smaller timeframes, though uncertain whether to count them
- Wants to distinguish between swings closest to current price vs. older structural walls, but is cautious about overcomplicating the chart
Context & Observations
- Post-World Cup timing noted as potentially relevant — the entity traded made significant revenue during that period
- Briefly considered whether the path up might mirror prior price behavior at the same daily levels, but decided to stay focused on current price action
- Noted that daily levels are historically difficult to break through, but precedent exists for price reaching the target again
