Bitcoin(BTC/USD) Daily Chart Analysis For Week of August 7, 2026
Bitcoin / U.S. dollar BITSTAMP:BTCUSD
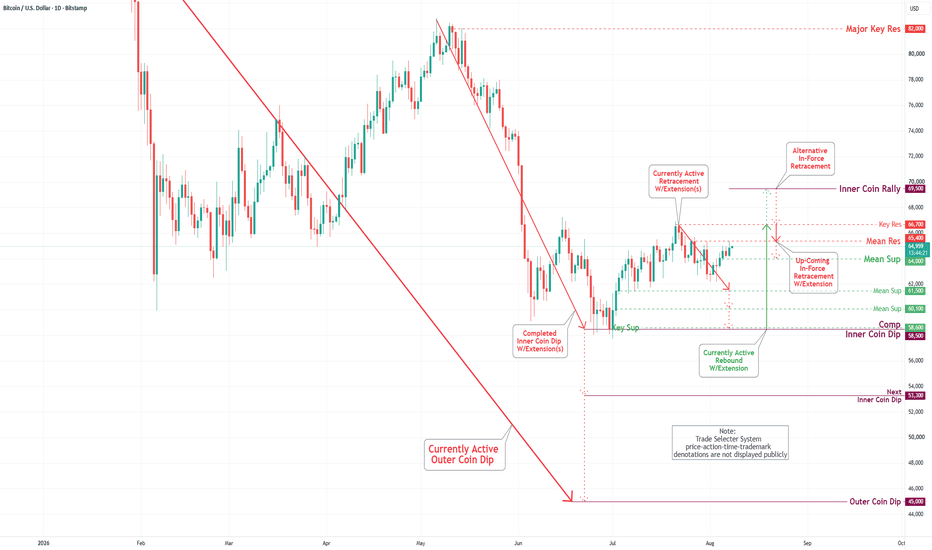
Technical Analysis and Outlook:
Bitcoin has shown and is showing a continuous price rise, reaching the Mean Support level of $65,400, where it is currently resting.
Trading activity indicates a strong bullish trend, with potential price advancement aimed at the critical Key Resistance level of $66,700. There is also a strong possibility of further movement toward the Inner Coin Rally target of $69,500.
On the downside, Bitcoin is expected to face an initial In-Force retracement from the Key Resistance level of $66,700, followed by a severe In-Force retracement once the Inner Coin Rally target of $69,500 is reached.