Following the data release, we will focus on these two areas.
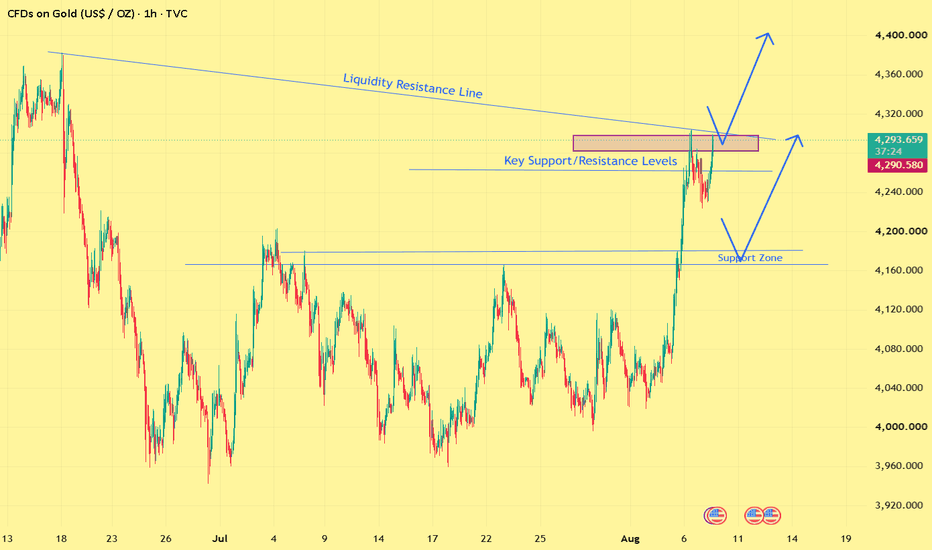
Gold rose to around 4304 yesterday before retreating under pressure, failing to hold the $4300 level effectively. The daily chart closed with a doji candlestick. From a candlestick pattern perspective, gold still has room for a pullback, but with today's non-farm payroll data release, we will not blindly predict the trend. However, considering yesterday's initial jobless claims data was bearish for gold, there was no significant volatility in gold prices. Therefore, I believe the bulls currently have a significant advantage, and the overall trading strategy leans towards a bottoming-out and rebound.
Last month's unexpectedly strong non-farm payroll data triggered a rapid rise and fall in gold prices. This time, 80,000 new jobs are not considered high. If the data again falls short of expectations and the previous value, gold will likely break through $4300 again.
Today is Friday, and there is more data to be released. Since we have achieved considerable profits for four consecutive days, our trading strategy today will be more conservative. If the data is bearish for gold, the support level is at 4170-80. A pullback to this area could present a buying opportunity. If the data is favorable for gold, and gold rises sharply, we can go long in the 4280-4300 range, based on the support and resistance levels.