
ACTUSDT — LONG-TERM DESCENDING TRENDLINE BREAKOUT SETUP?
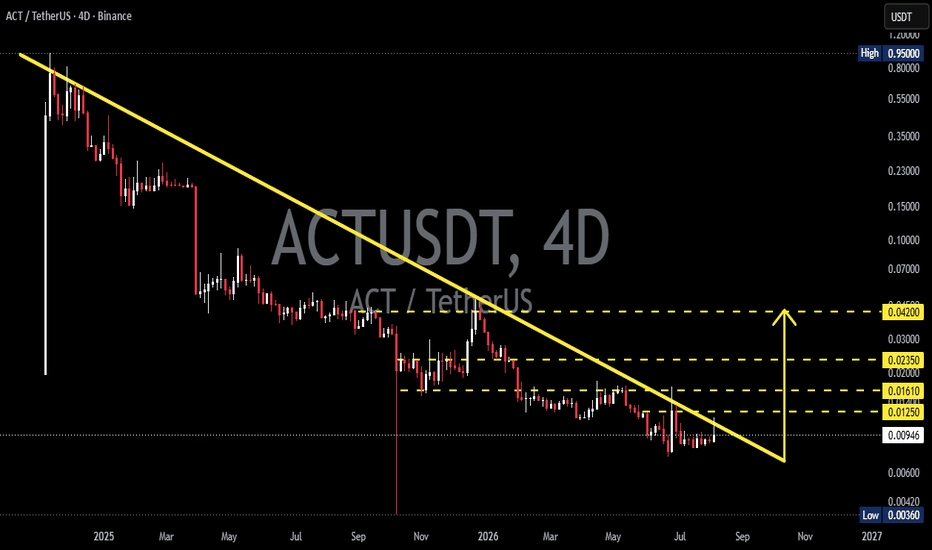
📊 Technical Analysis
💵 Coin:
 ACT
#ACT
ACT
#ACT
⏳ Time Frame: 4D
📉 Pattern: Descending Trendline
🎯 Targets: $0.01250 → $0.01610 → $0.02350 → $0.04200
---
📉 Market Structure
ACT has been trading within a long-term bearish structure, forming a series of lower highs and lower lows since the major high around $0.95.
The Descending Trendline has acted as major dynamic resistance for an extended period, repeatedly rejecting price.
However, ACT is now approaching a potentially important trendline breakout area, which could signal an early transition from a bearish structure toward a potential reversal. 🔄
---
🟢 Bullish Scenario — Potential Trend Reversal
If ACT can successfully break above the Descending Trendline and confirm the breakout with a 4D candle close, bullish momentum could strengthen. 📈
🟢 $0.01250 → First important resistance
🟢 $0.01610 → Next resistance / momentum zone
🟢 $0.02350 → Major resistance
🚀 $0.04200 → Major upside target
A successful breakout + retest of the trendline would provide stronger confirmation that the long-term bearish structure may be changing.
🔥 A move above $0.01250 would be an important step toward validating the bullish scenario.
---
🔴 Bearish Scenario — Breakout Failure
If ACT fails to maintain the breakout and gets rejected back below the Descending Trendline, the breakout could become a false breakout. ⚠️
🔻 Price could return toward the $0.00949 area.
🔻 Further weakness could bring ACT toward $0.00600–$0.00700.
🔻 A deeper breakdown could expose $0.00420–$0.00360.
A sustained move below the major support zone would invalidate the current bullish reversal setup.
---
🧩 Pattern Explanation — Descending Trendline
📐 A Descending Trendline represents a persistent bearish trend where sellers continue to appear at lower price levels.
In ACT's case, the trendline has remained respected over a long period.
Therefore, the most important confirmation is whether ACT can finally break, close above, and retest the trendline as support.
💡 The breakout itself is not enough — confirmation is key.
---
🎯 Key Levels
🟢 $0.04200 — Major upside target
🟡 $0.02350 — Major resistance
🟡 $0.01610 — Intermediate resistance
🟡 $0.01250 — First key bullish level
⚪ $0.00949 — Current price area
🔴 $0.00600–$0.00700 — Lower support
🔴 $0.00420–$0.00360 — Major historical support
---
📌 Overall Outlook
🟢 Bullish: Breakout + 4D confirmation + successful retest → potential move toward $0.01250 → $0.01610 → $0.02350 → $0.04200
🔴 Bearish: Rejection from the trendline + loss of support → potential continuation toward lower support zones.
🔥 ACT is approaching a critical long-term decision point. The Descending Trendline remains the key level to watch.
#ACT #ACTUSDT #Crypto #Altcoins #TechnicalAnalysis #DescendingTrendline #TrendlineBreakout #CryptoTrading #PriceAction #Binance #CryptoAnalysis #AltcoinSeason
