XAUUSD: ABC Pullback Before the Next Bullish Move
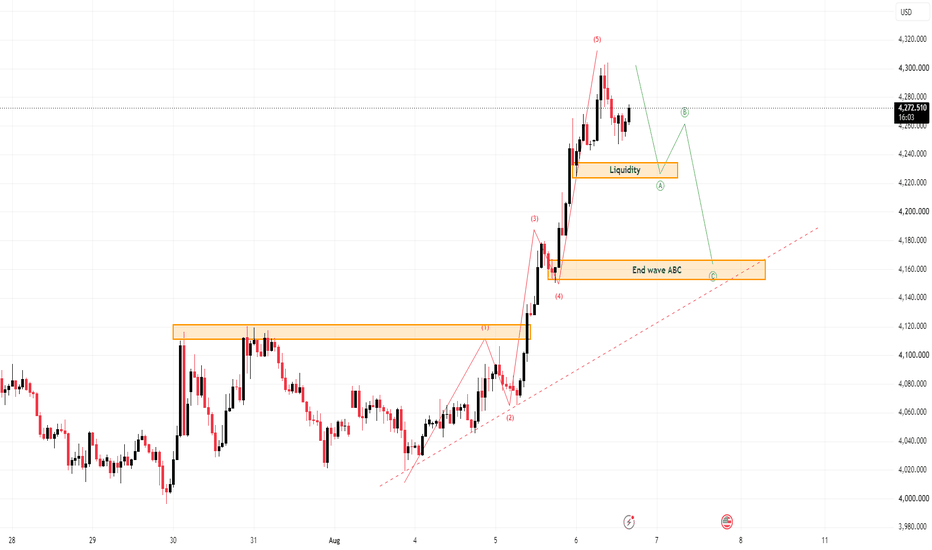
Gold has just made a strong upside move and is now showing signs of short-term exhaustion near the upper area. From Kelly’s view, the main trend is still constructive, but price may need a corrective ABC pullback before the next bullish continuation becomes cleaner.
The key idea is simple: gold is still bullish, but buying after a correction is safer than chasing near the top.
⟡ Market structure
The chart shows gold pushed strongly from the 4,150–4,160 area and completed a short-term Elliott wave 5 near the upper zone around 4,290–4,310. After this strong rally, the market is now reacting around 4,272.
This reaction does not mean the bullish trend is over. It may simply be the start of a healthy correction. The first important liquidity zone sits around 4,220–4,230. If price pulls back into this zone and buyers defend it, gold may create wave A and wave B before continuing higher.
If the correction becomes deeper, the stronger zone to watch is 4,155–4,165, marked as the possible End wave ABC area. This level is also close to the rising trendline, making it an important support base for the next bullish setup.
➤ Key levels
◌ 4,272: current price reaction area
◌ 4,290–4,310: recent wave 5 high and short-term resistance
◌ 4,220–4,230: liquidity zone and first pullback support
◌ 4,155–4,165: End wave ABC / major buy reaction zone
◌ 4,320: next bullish extension if price breaks the recent high
◌ Below 4,150: area where the bullish setup starts to weaken
⌁ Elliott Wave view
From an Elliott Wave perspective, gold appears to have completed a bullish 5-wave impulse after the strong breakout.
Wave 1 started the recovery from the lower base.
Wave 2 corrected but respected the bullish structure.
Wave 3 delivered the strong expansion move.
Wave 4 created a small pullback before continuation.
Wave 5 has now pushed gold into the upper area, where price is showing rejection.
After a completed wave 5, an ABC correction is normal. Wave A may pull price back towards the 4,220–4,230 liquidity zone. Wave B may create a small rebound. Wave C may complete near 4,155–4,165 if the market needs a deeper reset.
If that support holds, gold may prepare for the next bullish continuation phase.
▸ Trading scenario
Preferred scenario: wait for gold to correct into support and show bullish confirmation.
Entry zone 1: 4,220–4,230 if bullish reaction appears
Entry zone 2: 4,155–4,165 if deeper ABC correction happens
Stop loss: below the confirmed wave C low or below 4,150
Take profit 1: 4,272
Take profit 2: 4,290–4,310
Take profit 3: 4,320+ if bullish momentum continues
Alternative scenario: if gold breaks below 4,150 with strong bearish pressure, the ABC correction may become deeper. In that case, the bullish continuation setup needs to be reassessed before looking for another buy.
⌁ Kelly’s view
For Kelly, gold remains in a bullish structure, but the market is now too close to the upper reaction area to chase blindly.
The cleaner plan is to wait for the ABC correction. If price pulls back into 4,220–4,230 or deeper into 4,155–4,165 and buyers defend the zone, the next bullish move may continue.
Gold may correct first.
If the support zones hold, the bullish trend can continue again.
Share your view below.