

XAU/USD Masterclass | How to Measure Cycles and Predict Market
Gold OANDA:XAUUSD
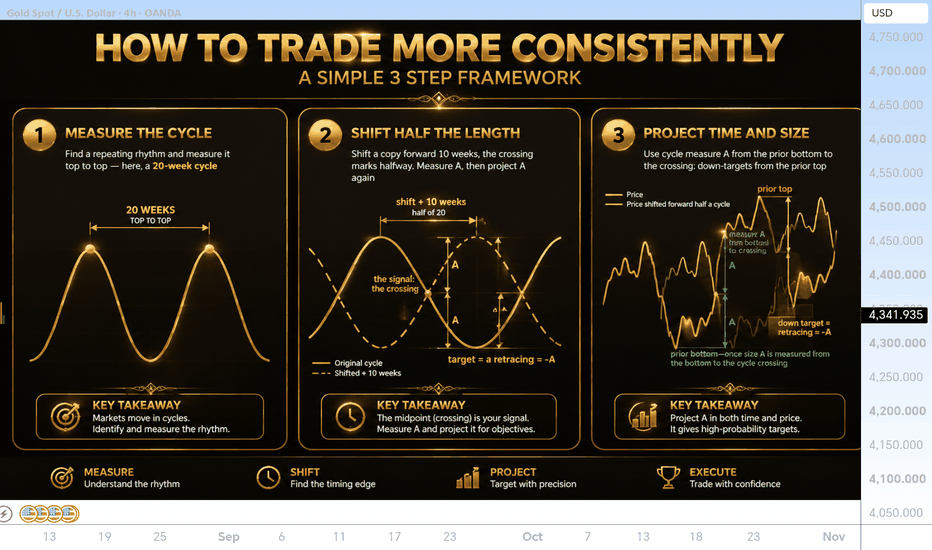
Gold Market Cycle Analysis | Time, Price & Trend Projection Masterclass

This advanced educational chart explains the professional approach of Gold market cycle analysis, where traders study the relationship between time, price movement, market rhythm, and previous historical patterns to understand possible future market behavior.
Every candle on the chart represents a specific battle between buyers and sellers. By studying candle formation, cycle length, price movement, and repeated market behavior, traders can identify potential turning points, continuation zones, and important market phases.
---
1. Cycle Measurement — Understanding Market Rhythm
The first step in cycle analysis is identifying a complete price movement from one major top to another major top, or from one important bottom to another important bottom.
Candle Explanation:
Starting Bullish Candles: Early bullish candles show increasing buying pressure and the beginning of a market expansion phase. Buyers gradually gain control as price starts creating higher levels.
Strong Expansion Candles: Large bullish candles indicate strong momentum and aggressive participation from buyers. These candles often appear when market demand increases.
Peak Formation Candles: Near the cycle top, candles become smaller and slower. This shows that buying pressure is weakening and sellers may start entering.
Reversal Candles: Bearish candles appearing after the peak indicate a shift in market control from buyers to sellers.
Decline Phase Candles: Continuous bearish candles create the next cycle movement, completing the relationship between previous high and future price behavior.
Reason: Markets often move in repeating cycles because trader psychology, liquidity, and institutional activity create similar patterns over time.
---
2. Cycle Shift — Time Projection Analysis
The second concept explains how a previous market cycle can be shifted forward to study possible future timing.
Candle Explanation:
Previous Cycle Candles: Historical candles show how price behaved during an earlier market phase.
Shifted Cycle Movement: The previous pattern is moved forward in time to compare possible similarities with current price action.
Matching Candles: When current candles start behaving similarly to previous cycle candles, traders watch for possible repeated reactions.
Turning Point Candles: Important candles near cycle completion can indicate possible reversal or continuation areas.
Momentum Candles: Strong candles after the cycle point show confirmation that the market direction is continuing.
Reason: Time cycles help traders understand when important market reactions may happen, but confirmation from price action remains necessary.
---
3. Time & Price Projection — Future Target Analysis
The final step combines previous cycle movement with price measurement to estimate possible future targets.
Candle Explanation:
Base Formation Candles: Small candles near a low area indicate accumulation, where buyers may slowly enter the market.
Breakout Candles: Strong bullish candles breaking previous resistance show increased demand and possible trend continuation.
Acceleration Candles: Large momentum candles represent aggressive buying and expansion.
Target Reaching Candles: As price approaches previous highs, candles may slow down because traders start taking profits.
Reaction Candles: Wicks and rejection candles near targets show where market participants are defending levels.
Reason: Price often reacts around previous cycle highs and lows because these areas contain liquidity and historical interest.
---
Gold Candle Psychology Analysis
Every candle provides important information:
Bullish Candle:
Shows buyers are stronger than sellers. The larger the body, the stronger the momentum.
Bearish Candle:
Shows sellers are controlling the market and pushing price lower.
Long Wick Candle:
Shows rejection. One side attempted to move price but failed.
Small Body Candle:
Shows uncertainty and balance between buyers and sellers.
Large Momentum Candle:
Shows institutional participation and strong market interest.
Repeated Candle Pattern:
Shows market psychology repeating through different cycles.
---
Professional Cycle Trading Framework
This chart teaches traders how to analyze:
Previous Market Cycles
Time-Based Price Movement
Historical Repetition
Trend Continuation
Reversal Possibilities
Support & Resistance Timing
Market Psychology
Future Price Projection
The purpose of cycle analysis is not to predict the market with certainty, but to understand where price has reacted before, how long movements usually last, and where important decisions may occur.
A professional trader does not only watch candles — they study the story behind every candle, the timing behind every move, and the psychology behind every market cycle.
Learn the cycle. Understand the movement. Master the market structure.
