
"XAU/USD 15M: Gold Pulls Back Into Key Demand Zone—Will Buyers D
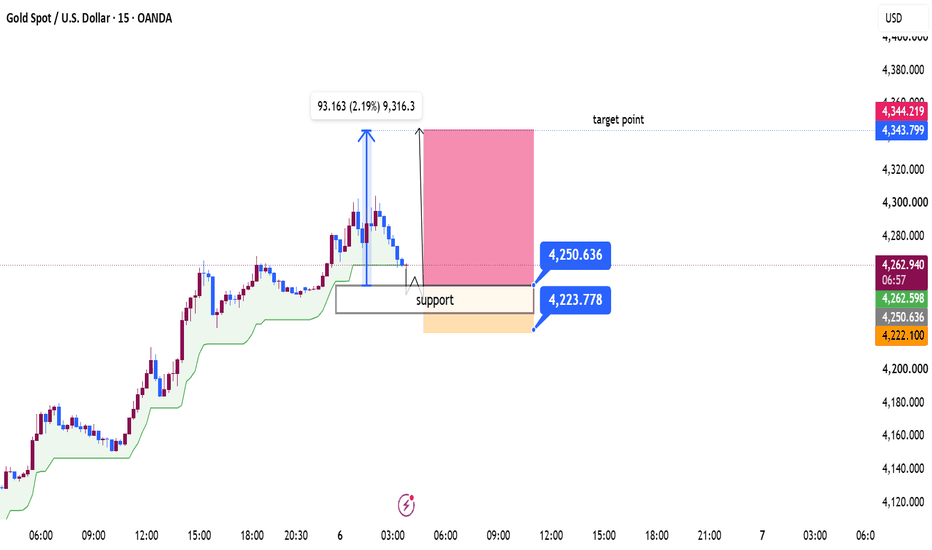
XAU/USD (Gold) – 15-Minute Technical Analysis
Based on the chart, gold is pulling back after a strong impulsive rally and is approaching a key demand/support zone. The current structure still favors buyers if support holds.
Market Structure
Trend: Bullish (higher highs and higher lows remain intact).
The recent rally created a new swing high around 4,294, followed by a healthy retracement.
Price is now testing the previous breakout area and dynamic support (green trend line).
Key Support Zone
Support: 4,223 – 4,250
This area aligns with:
Previous consolidation.
Breakout retest.
Dynamic trend support.
A bullish reaction from this zone would indicate buyers defending the trend.
Resistance Levels
Immediate Resistance: 4,294
Major Target: 4,343 – 4,344
A break above 4,294 increases the probability of reaching the marked target zone.
Bullish Scenario
Watch for:
Bullish engulfing candle.
Strong rejection wick.
Higher low formation on the 15-minute timeframe.
If buyers defend 4,223–4,250, price could rally toward:
Target 1: 4,294
Target 2: 4,344
Bearish Scenario
A decisive 15-minute close below 4,223 would invalidate the immediate bullish setup.
In that case, gold could continue correcting toward lower demand zones before finding fresh buying interest.
Trading Idea
Bias: Bullish while above 4,223
Buy Zone: 4,223–4,250
Confirmation: Bullish reversal candle or market structure break to the upside.
Targets: 4,294 → 4,344
Invalidation: Sustained close below 4,223
Summary
Gold is currently in a retracement within an overall uptrend. The highlighted support zone around 4,223–4,250 is the key decision area. If buyers step in, the chart suggests a continuation toward 4,344. A breakdown below support would weaken the bullish outlook and increase the likelihood of a deeper correction.
