Weekly Stock Watchlist August 10- 5 Great Breakout Setups
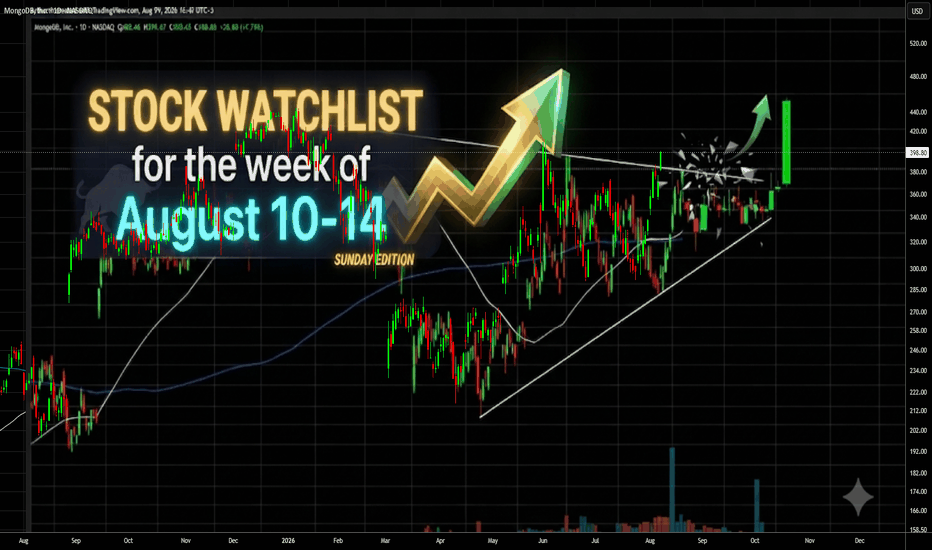
Before becoming a consistent trader I tried almost every strategy that you can think of, momentum trading, mean reversion, trend following and many more.
I finally found consistency when I started to focus and sharpened my tools on one setup, symmetrical triangle breakouts, a pattern that I consider perfect (at least for me!).
My sweet spot is swinging these breakouts for a few days, capturing a decent chunk of the move and then cashing out. Sure, sometimes I sell too early, but as long as I’m still making good money, there’s nothing to cry about.
Each Sunday, I watch dozens, and sometimes even more than 100 charts manually, in order to build my watchlist for the coming week. Most of the stocks on my watchlist are stocks that are consolidating in a triangle pattern and are about to break out, or have already broken out but are still in the early stages of the breakout, so there is plenty of room to the upside.
My Watchlist for August 10–14
DBX-

After the results came out positive on Thursday pre-market, I bought some shares after the market opened. My stop here is at $32.10, which is about $2 below my entry price, targets are on the chart.
 BA
BA
 SKY
SKY
 SW
SW
 MDB
MDB
If you found this content valuable, I’d really appreciate a boost and a comment. It helps me understand what you guys want to see more of and motivates me to keep creating and sharing these setups. Appreciate the support!