VWAP Volume Profile + Fibonacci Confluence: The ALB $155 Zone
Overview:
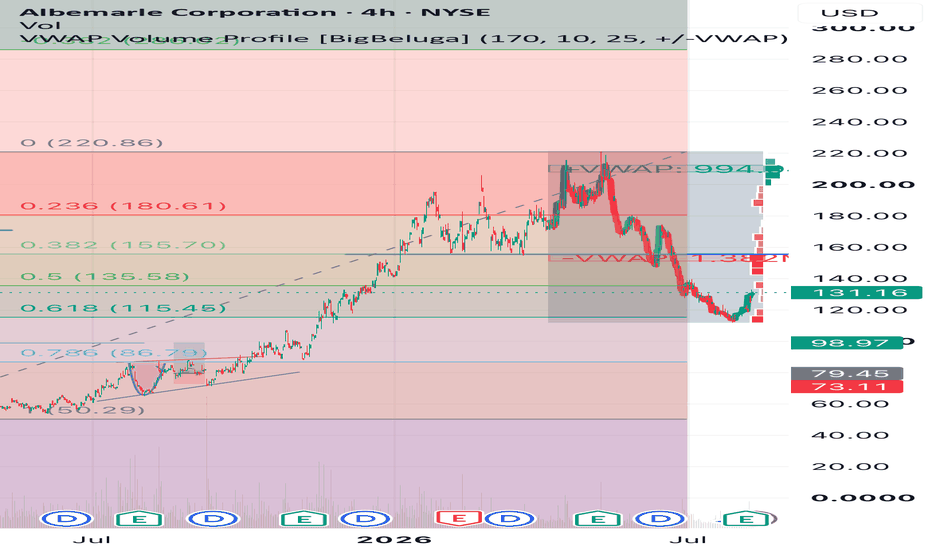
Following a 15-month advance from $50 (Apr 2025) to $220 (May 2026), price retraced to approximately $115 — near the 0.618 Fibonacci level. With price currently around $131, the question becomes: how might the next phase unfold?
Key Observations:
🔹 Coinciding levels at $155 The -VWAP (derived from a 3-month window, Apr–Jul 2026) converges at roughly $155 — the same area as the 0.382 Fibonacci retracement of the full 15-month swing. Two distinct calculations across different timeframes pointing toward a similar zone.
🔹 Volume structure remains tilted
-VWAP volume: ~1.38M (selling phases)
+VWAP volume: ~1M (buying phases)
Ratio: Approximately 1.4:1 — suggesting distribution may still outweigh accumulation
Possible Scenarios:
If price reaches $155 and shows signs of weakness, it could potentially face rejection given the dual confluence and prevailing volume structure. Alternatively, a close above $155 accompanied by expanding +VWAP volume might suggest a shift toward bullish conditions.
Should price hold or stabilize near $115, that could represent a support bounce. A break below, however, would weaken the long-term structure further.
For educational purposes only. Not financial advice.