
USOIL Sell Setup | Bullish Momentum Continues
USOIL Buy Setup | Breakout Could Trigger a Strong Recovery 📈
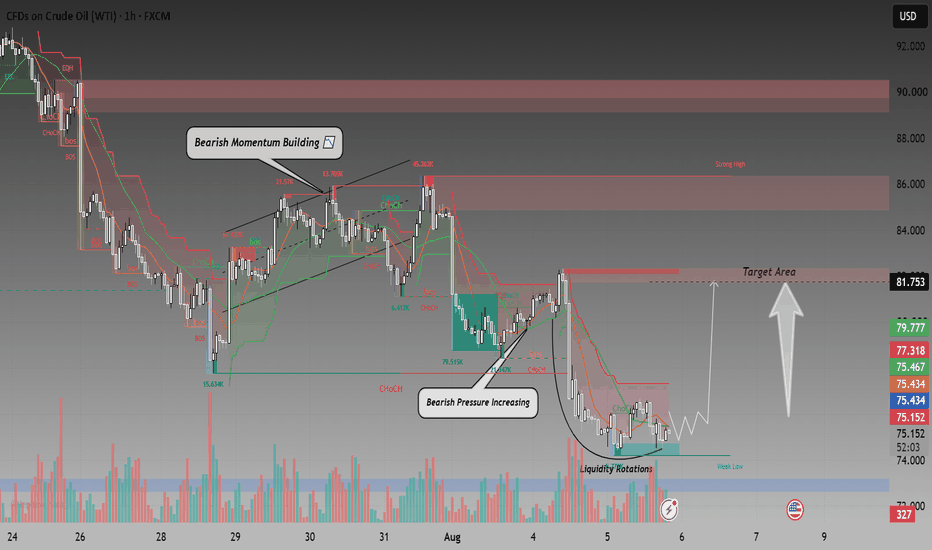
USOIL (WTI Crude Oil) is currently trading near a key demand zone after an extended bearish move. The recent price action suggests that selling momentum is beginning to slow, while buyers are attempting to defend support and build a base for a potential recovery. If the market successfully breaks above the nearby resistance, it could mark the beginning of a bullish reversal and open the door for higher prices.
The current consolidation reflects a battle between buyers and sellers. A confirmed breakout above the short-term resistance, supported by strong volume and bullish candle closes, would strengthen the bullish outlook and increase the probability of a sustained upward move.
🎯 Bullish Scenario:
If buyers maintain control and price closes above the highlighted resistance zone, the recovery could extend toward the following targets:
• Target 1: 76.20
• Target 2: 77.30
• Target 3: 79.00
• Extended Target: 82.00
A successful breakout followed by a healthy retest would confirm bullish continuation and attract additional buying momentum.
📉 Bearish Scenario:
If price fails to hold above support and breaks below the demand zone, sellers may regain control.
Bearish Targets:
• 74.80
• 74.20
• 73.20
A decisive close below support would invalidate the bullish setup and signal a continuation of the broader downtrend.
📊 Trading Perspective:
Although the larger trend has been bearish, the market is showing early signs of stabilization around a major support area. Traders should wait for confirmation before entering long positions. A breakout above resistance with increasing volume would provide a stronger probability setup than buying during consolidation.
📍 Key Support Zones:
• 74.80
• 74.20
• 73.20
📍 Key Resistance Zones:
• 75.80–76.20
• 77.30
• 79.00
• 82.00
📝 Trade Plan:
• Wait for a confirmed breakout above resistance before considering long positions.
• Enter on a breakout or a successful retest of the broken resistance.
• Place the stop-loss below the nearest swing low or the demand zone.
• Take partial profits at each target while trailing the stop-loss to lock in gains as the trend develops.
⚠️ Risk Management:
Risk only 1–2% of your account on a single trade. Always wait for confirmation, avoid chasing large bullish candles, and monitor high-impact news such as EIA Crude Oil Inventories and OPEC-related developments, as they can significantly influence oil prices.
💡 Key Points:
• Price is attempting to form a base at a key demand zone.
• A breakout above resistance could confirm a bullish reversal.
• Buyers need to reclaim higher highs to validate the recovery.
• Bullish targets are 76.20, 77.30, 79.00, and 82.00.
• Failure to hold support would invalidate the bullish setup.
• Patience, confirmation, and disciplined risk management remain essential for successful trading.
This analysis is based on the current technical structure and is intended for educational purposes only. Always combine technical analysis with your own strategy and proper risk management before making any trading decisions. 📈🛢️
