
btcusdt
BTC 4H
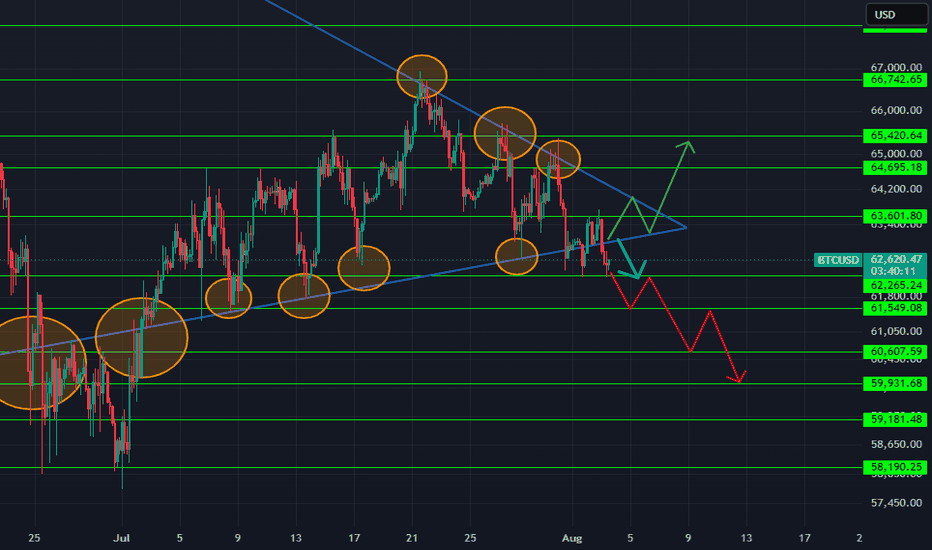
Bitcoin on the 4-hour timeframe has completed a symmetrical triangle structure and has now broken below the ascending trendline. This downside breakout signals weakening buyer momentum and suggests a short-term corrective phase. Price is currently fluctuating around $62,490, and according to the projected scenario, a pullback to the broken trendline followed by continuation to the downside remains possible.
For this breakdown to be confirmed, a 4-hour candle close below $62,000 is important. If price fails to hold below this zone and leaves long lower wicks, a fake breakdown and a return back inside the triangle cannot be ruled out.
Key levels ahead are as follows:
Major resistances if price rebounds:
$63,601: first upside barrier
$64,695: mid-range resistance and triangle ceiling
$65,420: key level for any trend reversal attempt
Nearby supports:
$61,549: first downside target
$60,607: strategic support and order accumulation zone
$59,931: important psychological and technical support
58
,
180
𝑡
𝑜
58,180to
59,180: main demand zone and strong lower support area
This analysis is purely technical. Due to the high volatility of crypto markets, risk management and stop-loss discipline are essential.

