The Trend-Based Fibonacci tool is a technical analysis tool
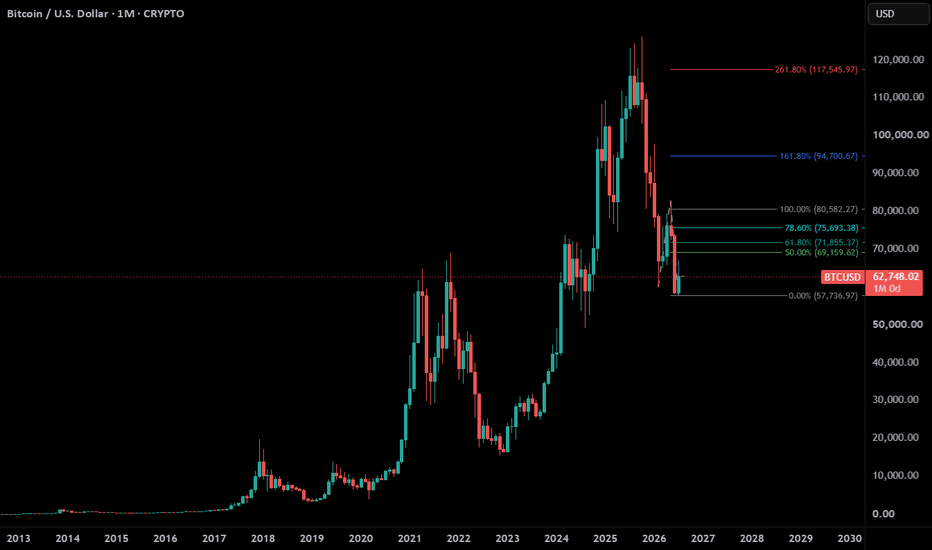
The Trend-Based Fibonacci tool is a technical analysis tool used to project future price targets by extending Fibonacci ratios beyond the completion of an initial price move. It helps traders identify where a trending price might encounter support or resistance and is commonly used for setting profit-taking levels.
How It Works
The Trend-Based Fibonacci tool is distinct from the more commonly known Fibonacci Retracement tool. While retracements measure pullbacks within an existing move, this tool is used to forecast where the price might go after the trend resumes.
You draw the tool by identifying three distinct points on a price chart:
Point A (Start of Trend): The beginning of a significant price swing.
Point B (End of Trend): The end of that initial swing.
Point C (End of Retracement): The end of the subsequent pullback against the trend.
Once these three points are plotted, the tool projects lines at key extension levels beyond Point B, such as 127.2%, 161.8%, 200%, and 261.8%. These levels are considered potential future support or resistance zones where the price may pause or reverse. The most significant level, often acting as the primary profit target, is the 161.8% extension, known as the golden ratio.
Here's a quick comparison to clarify the difference between the two main Fibonacci tools:
Aspect Trend-Based Fibonacci Extension Fibonacci Retracement
Function Projects price targets beyond the initial swing Identifies support/resistance within a pullback
Reference Points Three (A, B, C) Two (a swing high and swing low)
Key Ratios 127.2%, 161.8%, 200%, 261.8% 23.6%, 38.2%, 50%, 61.8%, 78.6%
Primary Use Setting profit targets Finding entry points for a trend continuation
How Traders Use It in Practice
Traders primarily use the Trend-Based Fib tool for the following:
Setting Profit Targets: After identifying a trend and its retracement, traders use the extension levels (especially 161.8%) to set logical "take profit" orders.
Risk/Reward Analysis: By knowing a potential target (the extension level) and placing a stop-loss below Point C, traders can calculate the risk/reward ratio before entering a trade.
Finding Confluence: The signal is considered more powerful when an extension level aligns with other technical indicators like moving averages, trendlines, or previous support/resistance levels.
Important Considerations
Subjectivity: A key limitation is the subjective selection of the three reference points (A, B, C). Different traders may choose different swing points, leading to different projections. A consistent personal methodology is important.
Not Foolproof: Like any technical tool, Fibonacci extensions do not guarantee price action. In very strong trends, prices can blow through these levels without pausing, while in weak trends, they may not reach them at all. The tool is best used as a guide, not an absolute prediction.