BTCUSD Sell Setup | Bearish Structure Targets Demand Zone
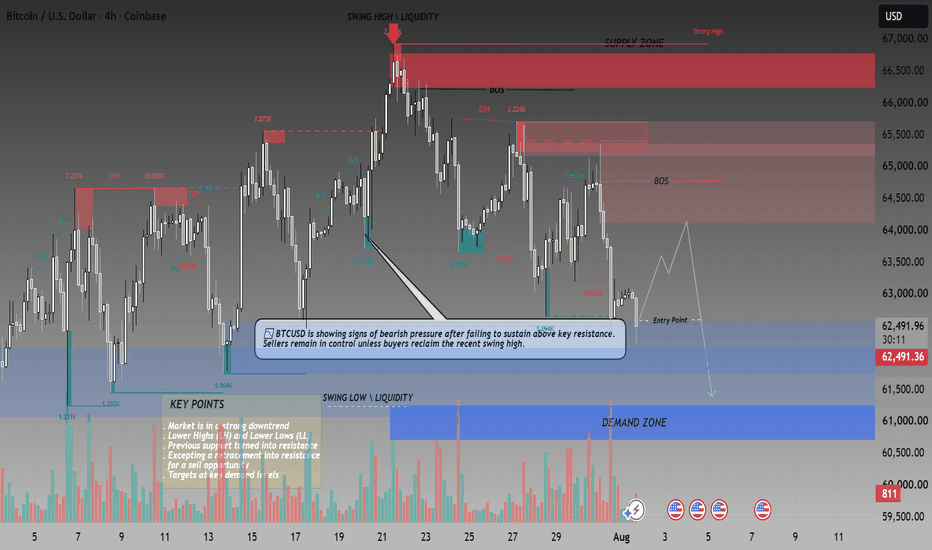
📉 BTCUSD 4H Analysis | Bearish Structure with Key Demand Zone in Focus
Bitcoin continues to trade under bearish market structure after failing to hold above the recent resistance area. The rejection from the upper supply zone confirms that sellers are still defending higher prices, while the market continues to print lower highs and lower lows. The recent break of structure and change of character indicate that bearish momentum remains dominant unless buyers regain control above the highlighted resistance zone.
The blue support area around 62,400–62,000 is currently acting as the first line of defense for buyers. This level is extremely important because it aligns with previous liquidity and has the potential to generate a short-term bounce. However, if this support fails to hold, price could quickly move toward the major demand zone around 61,200–60,900, where stronger buying interest may appear. 📍
On the upside, the nearest resistance is located around 64,400–65,500, which also overlaps with the marked supply zone. As long as price remains below this region, every rally may simply be a retracement within the larger downtrend. Sellers are likely to look for fresh short opportunities if price revisits this area and shows bearish confirmation. 📉
🎯 Support Zones:
• Immediate Support: 62,400–62,000
• Major Demand Zone: 61,200–60,900
🎯 Resistance Zones:
• First Resistance: 64,400–64,800
• Major Supply Zone: 65,300–66,800
📌 Bearish Scenario:
If BTCUSD breaks and closes below the current support around 62,400, the probability of further downside increases significantly. The next objective would be the major demand zone near 61,000, where liquidity is expected to attract buyers. A failure to defend that area could open the door for an even deeper correction. Traders may consider waiting for pullbacks into resistance before looking for fresh selling opportunities rather than chasing the move. 🔻
🚀 Bullish Scenario:
If buyers successfully defend the current support and produce a strong bullish reversal candle with increasing volume, Bitcoin could stage a relief rally toward 63,500 and eventually retest the 64,500–65,000 resistance area. A confirmed breakout and close above the supply zone would invalidate the current bearish structure and shift momentum back in favor of buyers, potentially targeting higher highs. 📈
📝 Trade Plan:
• Conservative traders can wait for a confirmed rejection from resistance before considering short positions.
• Aggressive sellers may monitor lower timeframes for bearish confirmations around the highlighted supply area.
• Buyers should wait for strong bullish confirmation from the demand zone instead of entering blindly.
• Avoid entering trades in the middle of the range where the risk-to-reward ratio is less favorable.
🎯 Potential Targets:
• Target 1: 62,000
• Target 2: 61,500
• Target 3: 61,000 Demand Zone
• Extended Target: Below 60,900 if bearish momentum accelerates.
⚠️ Risk Management:
Always trade with a predefined stop-loss and never risk more than 1–2% of your trading capital on a single position. Wait for candle confirmation before entering, avoid emotional trading during volatile moves, and adjust your position size according to market conditions. Bitcoin is known for sharp liquidity sweeps, so patience and disciplined execution are far more valuable than chasing price. 💰🛡️
Overall, the 4H chart continues to favor the bears while price remains below the major supply zone. The highlighted support is the key level to watch—holding above it could trigger a temporary recovery, while a clean breakdown would strengthen the bearish outlook and increase the probability of a move into the major demand zone. Stay patient, trade with confirmation, and let the market reveal its next direction. 📊🔥