
SOL 8H – Symmetrical Triangle at Decision Point
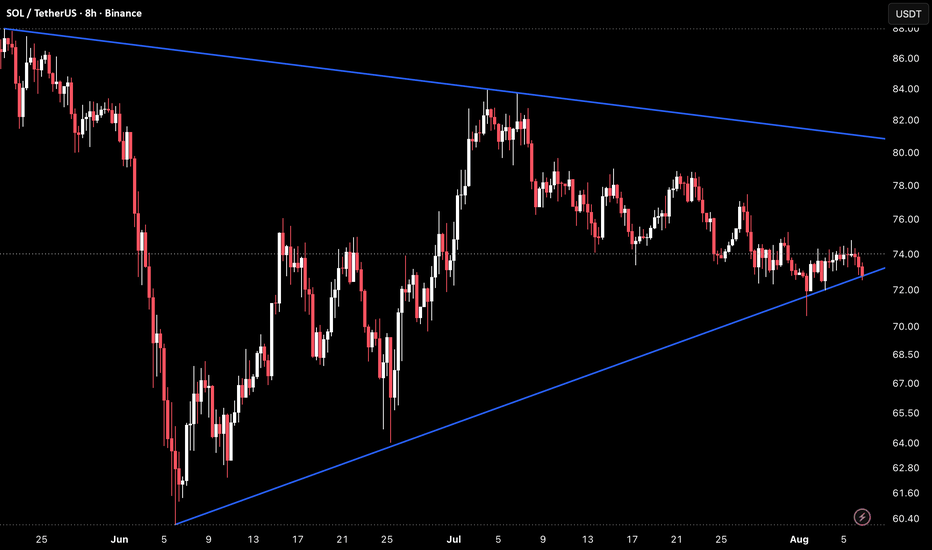
SOL on the 8H timeframe is currently trading around 86.46 after oscillating inside a symmetrical triangle since the late May low near 60.40, with the descending upper trendline and rising lower trendline now converging as price sits just above the 72.00–72.73 horizontal support and the rising lower trendline climbing into the 71.00–72.00 area.
The chart shows a symmetrical triangle formed by a descending upper trendline originating from the May high near 88.00, connecting through the July 1 high near 84.00 and continuing to slope down into the 80.00–82.00 area currently, while the rising lower trendline connects the May 26 low near 60.40 through the June 25 low near 64.00 and the August 5 low near 71.00–72.00, now climbing steeply into the current price zone. Price pushed from the lower boundary toward the upper trendline in late June and early July, reaching 84.00 before rolling over and declining steadily back through 78.00, 76.00, and 74.00 before pressing into the rising lower trendline near 71.00–72.00 on August 5. Two horizontal reference levels define the internal structure — one near 74.00 and a second near 72.00–72.73 — both of which have been crossed repeatedly throughout the compression and are now being tested simultaneously with the rising lower trendline.
The rising lower trendline, the 72.00–72.73 horizontal, and the 74.00 level are all converging at current price, creating the most significant support cluster seen inside this triangle and a high-stakes decision point as the structure approaches its apex.
Key Levels To Watch
→ 86.00–88.00 May high, major resistance above
→ 82.00–84.00 Descending upper trendline, overhead resistance (dynamic)
→ 78.00–80.00 Mid-triangle resistance zone
→ 74.00–75.00 Horizontal pivot, upper internal reference
→ 72.00–72.73 Horizontal support, lower internal reference
→ 71.00–72.00 Rising lower trendline, current test (dynamic, climbing)
→ Below 68.00 Triangle breakdown, extended downside
A hold at the rising lower trendline near 71.00–72.00 and a recovery back above 74.00–75.00 would keep the triangle structure intact and reopen a move toward the descending upper trendline near 82.00–84.00 as the next target.
A confirmed 8H close below the rising lower trendline near 71.00–72.00 would signal a bearish resolution out of the triangle, removing the upward structure from the May low and opening downside toward 68.00 and below with no clear horizontal support in between.
Converging support cluster at rising trendline and horizontal pivot, triangle decision imminent. Hold 71.00–72.00 trendline → structure intact, recovery toward 82.00–84.00. Lose trendline on confirmed close → bearish resolution, downside toward 68.00 and below. Bias neutral to cautiously bullish at lower boundary. Shift bearish only on confirmed close below rising lower trendline.
